Thinkorswim Mobile App Tutorial
Stock Market Guides is not a financial advisor. Our content is strictly educational and should not be considered financial advice.
When it comes to investing in the stock market from a mobile device, one app that many people use is Thinkorswim.
It's a trading app offered by TD Ameritrade that is popular among active stock market investors.
The Thinkorswim mobile app has a huge array features, which makes it powerful but also can make it overwhelming for new users.
This guide serves as a Thinkorswim mobile app tutorial. It covers the basic functionalities of the platform and shows you to use it to manage your investing portfolio and make trades.
What Is Thinkorswim?
Thinkorswim is a free trading app available from TD Ameritrade.
You can use it to buy stocks and options in the stock market.
TD Ameritrade customers can download Thinkorswim from here. It's available in different versions: desktop, web, and mobile.
Each version is unique and different from each other. This guide is focused exclusively on the mobile app.
Stock Market Guides
Stock Market Guides identifies stock investing opportunities that have a historical track record of profitability in backtests.
79.4%
Thinkorswim Mobile App Video Tutorial
This guide is going to walk you through the features of the Thinkorswim Mobile App and show how to use them, but if you prefer to get the tutorial in video format, you can watch this video we made:
Thinkorswim Mobile App: Core Navigation
In the Thinkorswim mobile app, the core navigation is at the bottom. You use the bottom menu to access the main features of the app.
That menu looks like this:
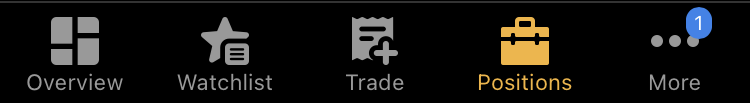
Let's walk through each of those menu items to see which functions are available in each section and how to use them.
Thinkorswim Mobile App: Overview Section
If you tap the Overview icon in the bottom menu of the Thinkorswim app, it provides general information about the status of the markets and of your account.
It looks like this:
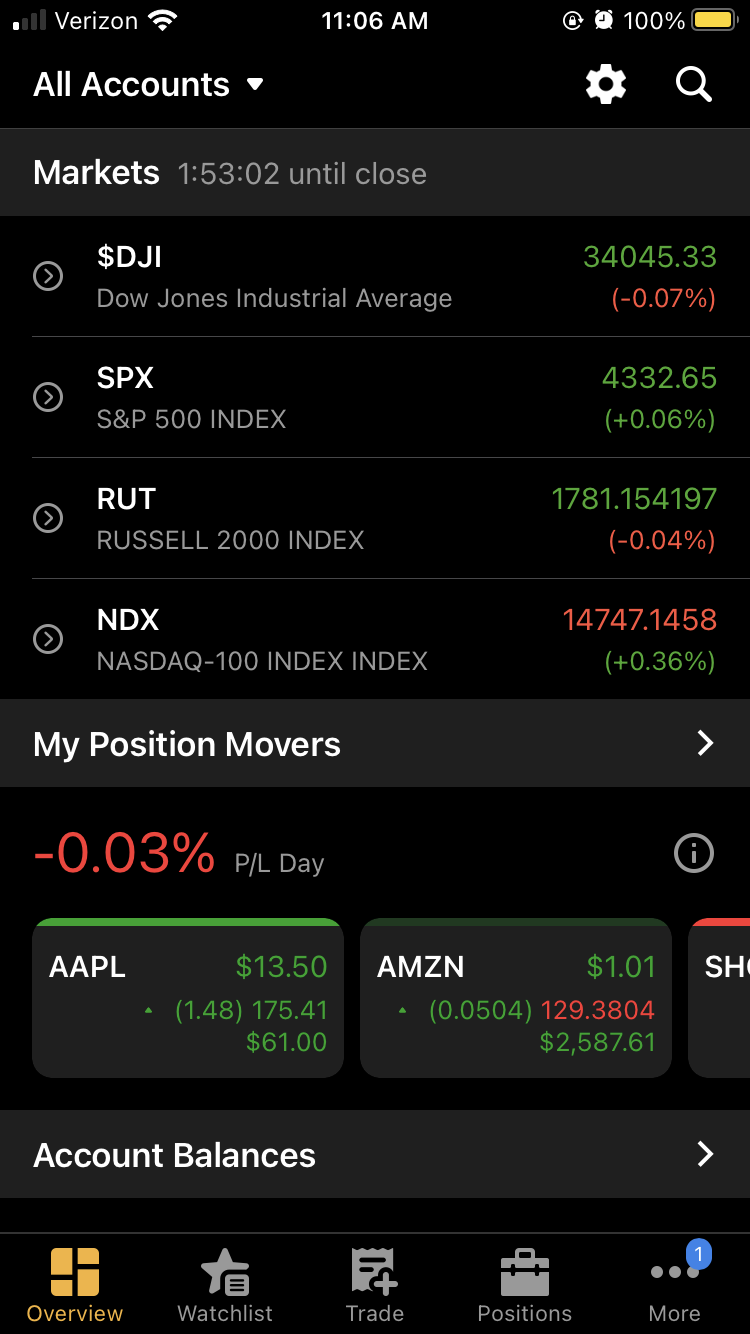
If you're using the app just to see how your account is doing or see what the markets look like for the day, this is where you'd go to see that.
You can also look up general information about any ticker symbol from here. You can tap that magnifying glass icon at the top right and then input a ticker symbol. Doing this will bring up a page of information for that ticker symbol. It looks like this in the Thinkorswim mobile app:
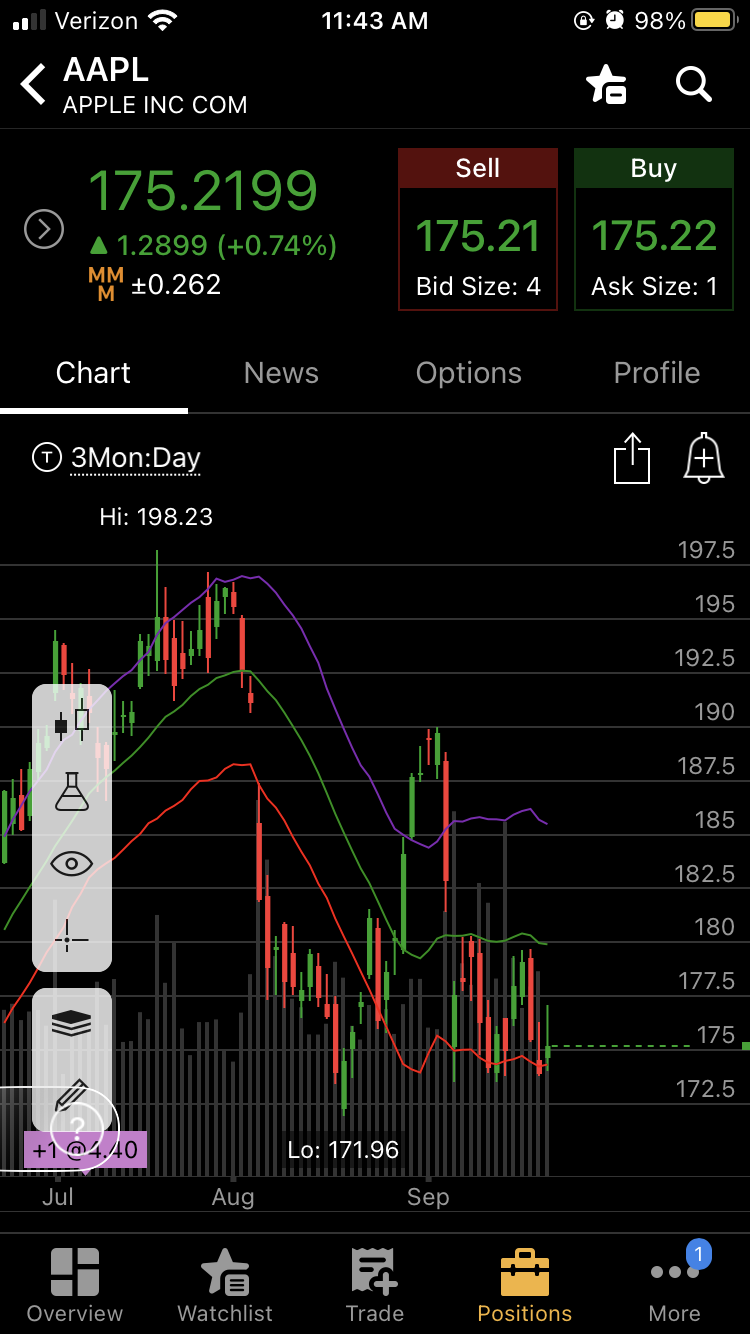
As that image shows, you can see the stock chart for the ticker symbol from that screen. We have a separate guide that teaches how to manage Thinkorswim charts.
On the mobile app, you can edit the chart settings by tapping any of the icons on the left in the gray menu. They will give you access to studies and indicators, and will also allow you to edit chart time frames and draw trend lines.
To zoom in on the chart, you put your fingers on the screen close together and then spread them apart, just as you would to zoom in on a picture on your phone. To zoom out, you do the opposite.
The image above shows that above the chart itself, there is a horizontal menu that has the term "Chart" highlighted. There are also menu items there for News and for an Options Chain for those interested in trading options in Thinkorswim's mobile app.
If you tap Options Chain, you'll see the options available for that underlying stock. Here's what it looks like:
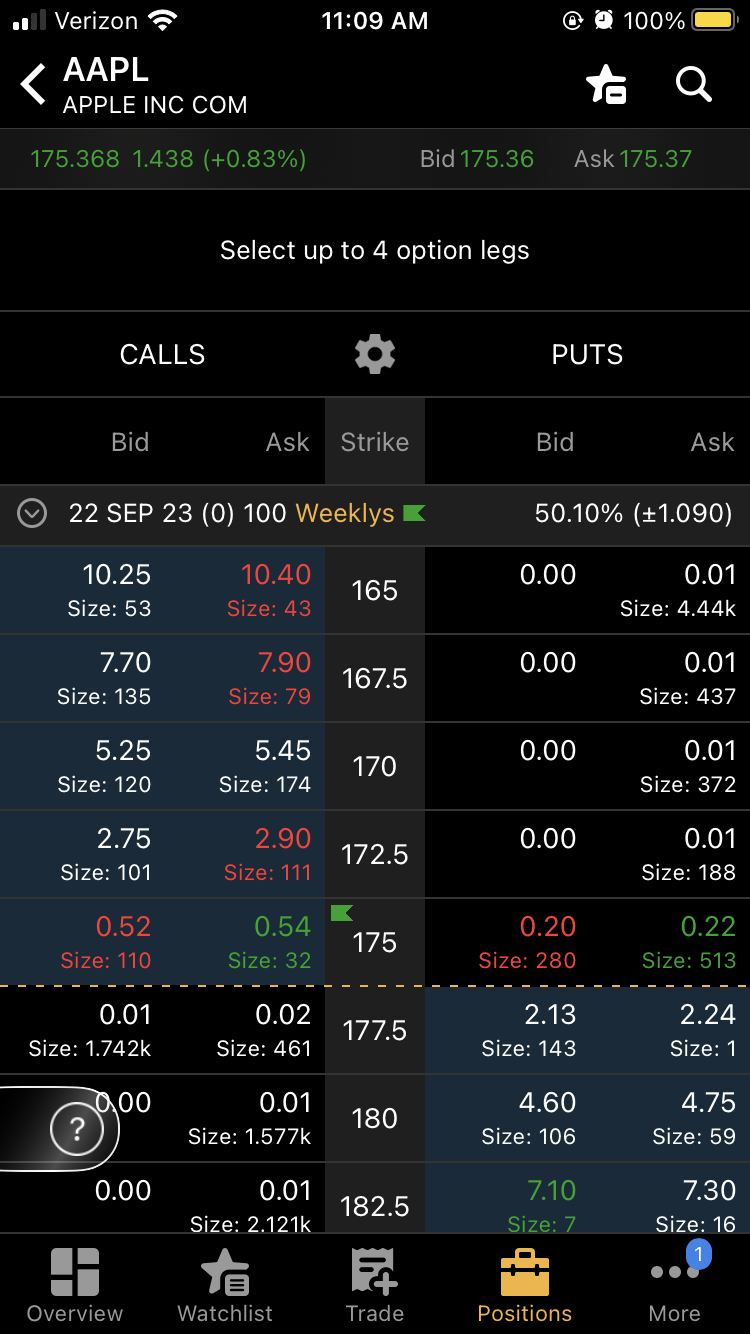
We really like the way the options chain looks in the Thinkorswim mobile app. It's dramatically simplified compared to typical options chains, and yet puts the most critical information at your fingertips.
From the options chain, you can select any given option to take you to the order window of the app, which is covered in detail in the next section.
Thinkorswim Mobile App: Trade Section
Tapping the "Trade" icon in the bottom menu of the Thinkorswim app takes you to the section where you go to make trades. It's also known as an order entry window.
You can buy or sell stocks from that screen. If you have an options or futures account enabled with TD Ameritrade (which you have to apply for separately), then you can trade them from this screen as well.
When you get to that screen of the app, it prompts you to enter a ticker symbol. After you type in the ticker symbol of the security you'd like to buy or sell, then it takes you to a screen that looks like this:
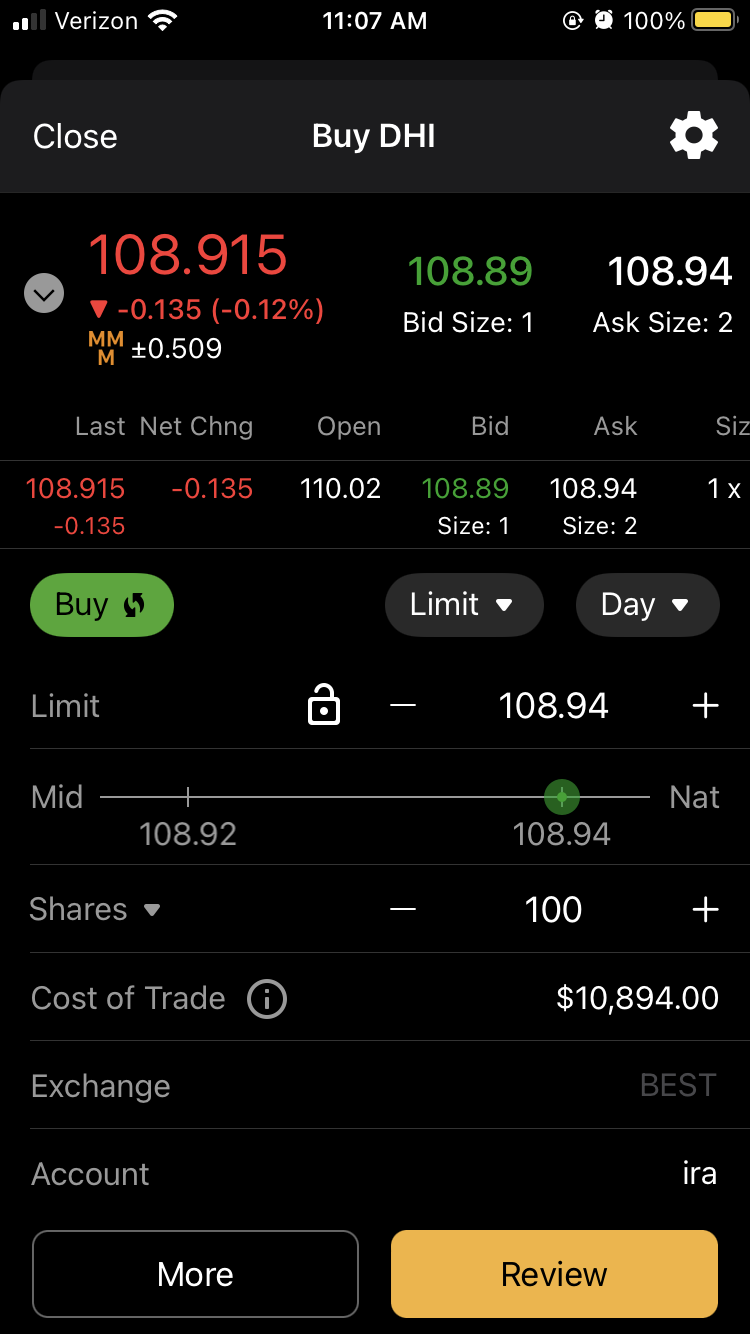
In that image, we show an example that has DHI stock loaded into the order entry window.
On that order entry window, you can see the price of the security as well as the bid and ask information for the security.
You can set up a trade by managing the following fields on the screen:
- Button to indicate if you want to buy or sell
- Button to indicate the type of order you want to place (i.e. Market or Limit order)
- Button to indicate the Time in Force (i.e. Good Till Canceled or Day)
- Place to indicate the number of shares or contracts you want to trade
If you decide on placing a limit order, there is a section where you can indicate the price you want to use for your limit order.
In short, this screen has everything you need in order to administer a trade in the stock market.
Thinkorswim Mobile App: Positions Section
Tapping the "Positions" icon in the bottom menu takes you to the section where you can view your portfolio details.
This is an image that show what it looks like:
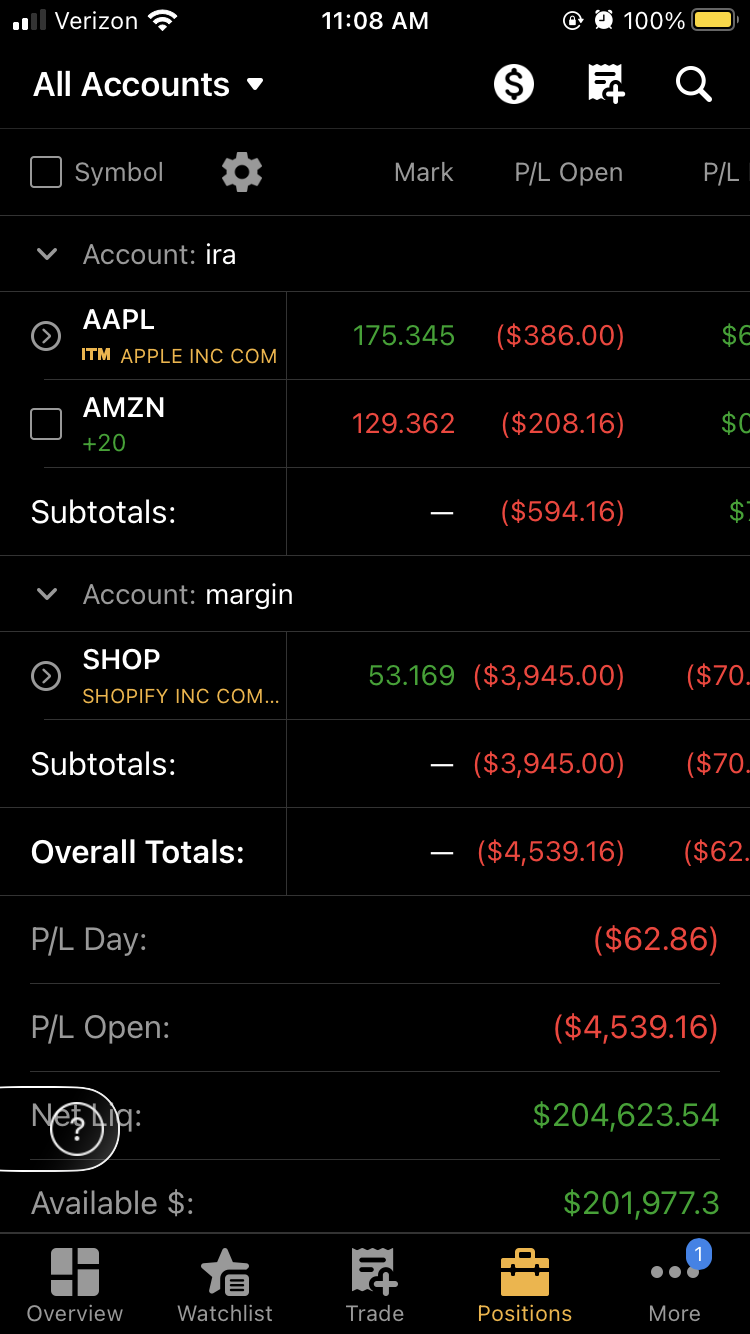
As you can see, it itemizes each security in your portfolio and shows its individual profit.
There is also a section at the bottom that shows the total profitability for the day and for all open positions.
This is the section of the app where you can see your account balance. The total account balance is reflected by the "Net Liq" value, which stands for Net Liquidity.
You can tap any of the ticker symbols on this page to either create closing orders or to review information about the security.
Thinkorswim Mobile App: Watchlist Section
Tapping the "Watchlist" icon in the bottom menu of the Thinkorswim app takes you to the section where you can set up watchlists. This image shows how it looks:
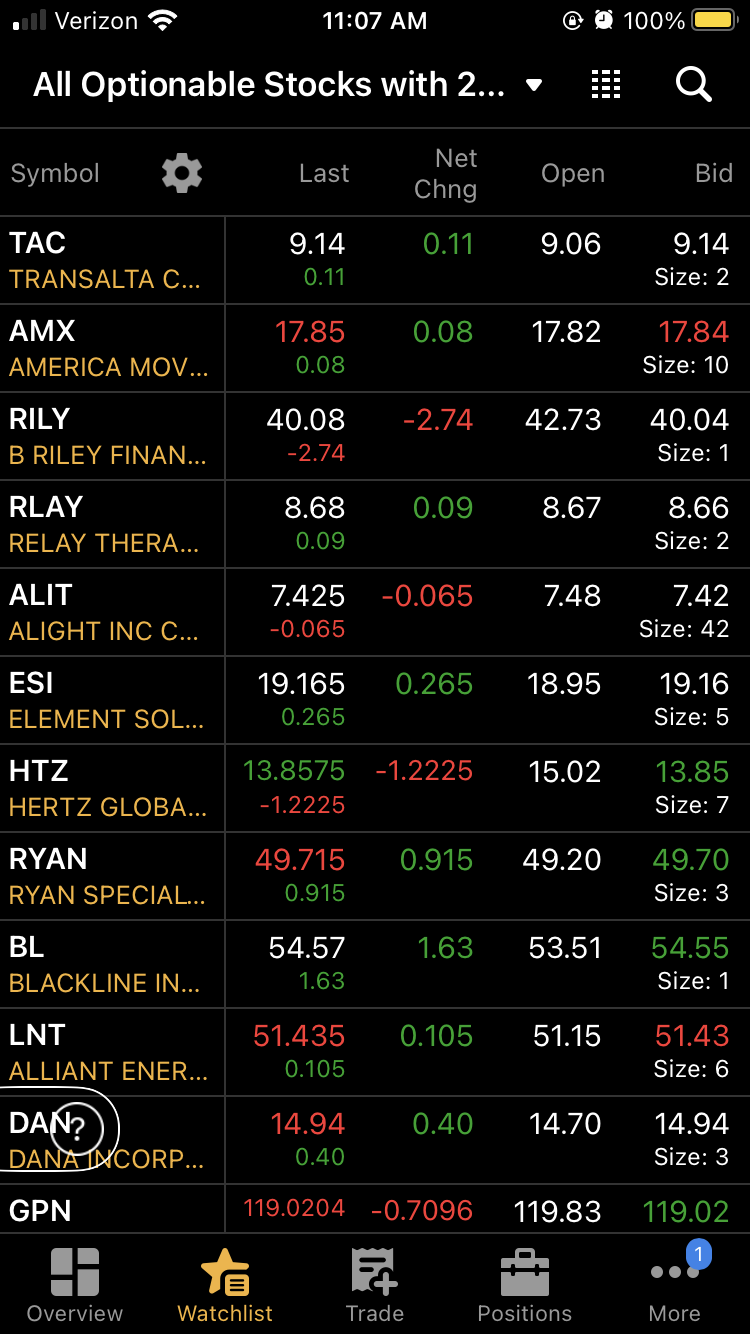
These watchlists can be ones you manually create for stocks you've independently determined that you want to watch.
It can also we where you see the results of Thinkorswim scans. If you tap the title of the watchlist at the very top of the screen, you can see other scans that are available.
For example, you can open watchlists that are a scan of the top 10 gainers for the day or the top 10 losers. You can also open a watchlist that shows all the stocks in a particular industry.
The watchlist section is a good place to go for doing research and also keeping track of tickers that you've already finished researching.
Thinkorswim Mobile App: "More" Section
You can find more capabilities of the Thinkorswim mobile app by tapping the "More" section in the bottom menu.
One of the key features here is the ability to set alerts for any given security. You'll see a bell icon in the More menu that you can tap to set up an alert.
The screen for setting an alert looks like this:
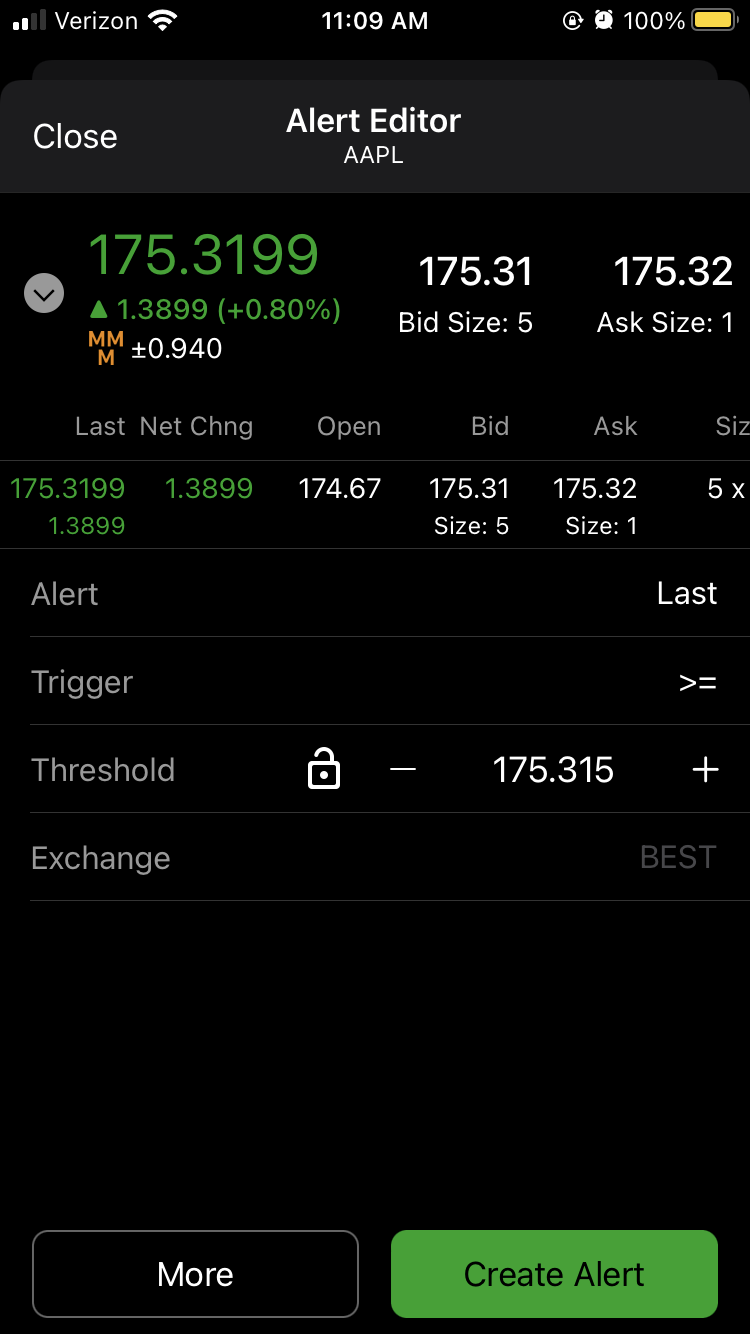
Setting alerts can be a helpful way to monitor any given security without manually checking on it.
For example, let's say you might want to buy Apple stock, but only if it reaches a particular price point. You can set up an alert that notifies you if the price of Apple stock ever goes below that price. You simply specify the price.
Learning More About Thinkorswim's Mobile App
You can contact us any time if you would like to ask any questions about the Thinkorswim mobile app, or about anything related to trading in general.
Join Our Free Email List
Get emails from us about ways to potentially make money in the stock market.
Stock Market Guides
You can trade without an edge, but why?
What We Offer
Stock Market Guides identifies stock investing opportunities that have a historical track record of profitability in backtests.
79.4%