What Is a Pullback in Stocks?
Stock Market Guides is not a financial advisor. Our content is strictly educational and should not be considered financial advice.
Just about anyone who has taken an active interest in the stock market has heard the term "pullback". It's mentioned a lot when describing the price activity of stocks.
This article explains what a pullback is, explains why it can be important to investors, and gives an example of how it looks on a stock chart.
What Exactly Is a Pullback?
A pullback in stocks refers to price activity that occurs during an uptrend in the stock market.
It happens when a stock's price is trending upward, but temporarily slows down and comes down before potentially continuing its uptrend.
In simpler terms, a pullback is a short-term dip or decline in the price of a stock that is otherwise in an upward trend.
Stock Market Guides
Stock Market Guides identifies swing trading opportunities that have a historical track record of profitability in backtests.
79.4%
Example of a Pullback
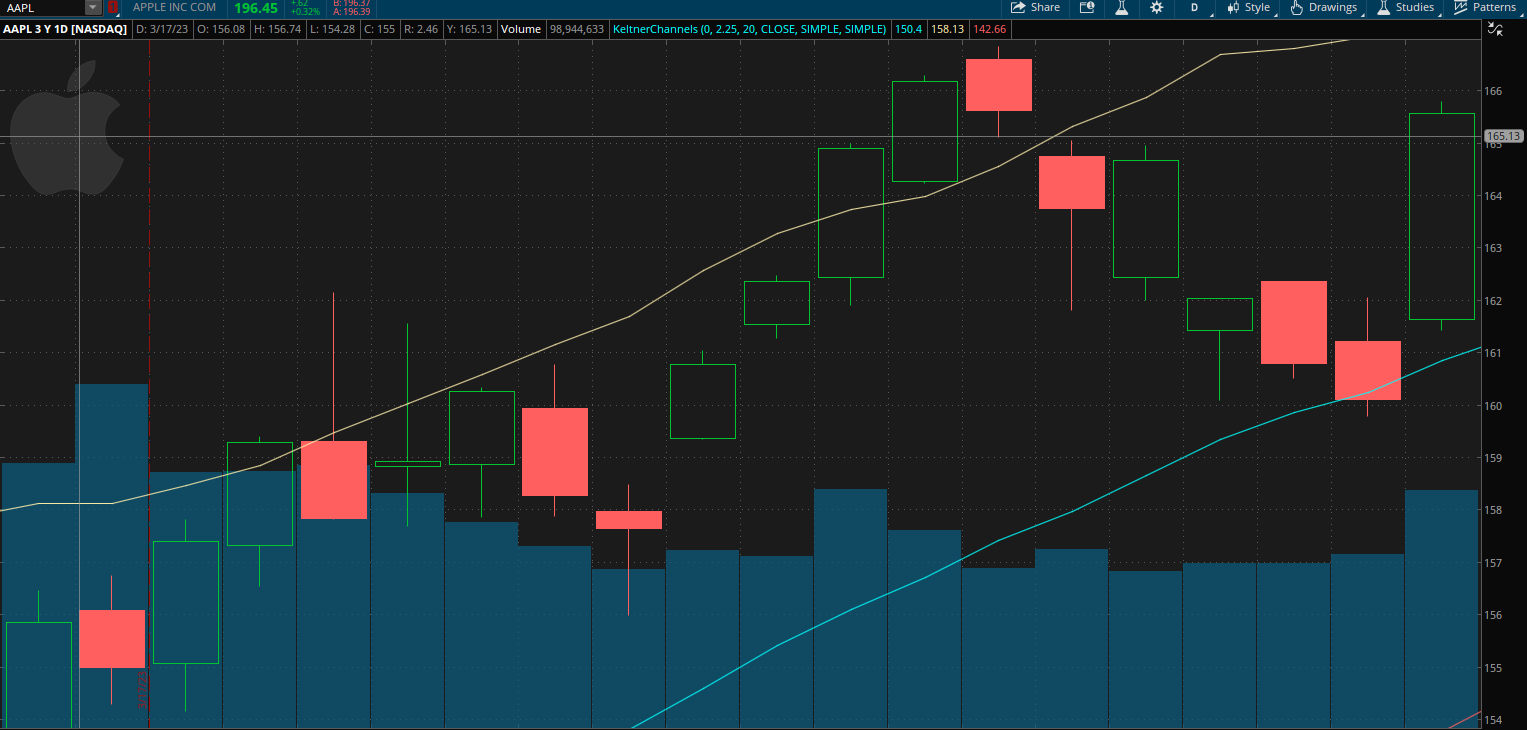
That image shows a stock chart for Apple. You can see that generally, the price moves from the bottom left to the top right of the chart.
Notice that along the way, at one point the price comes down and touches the blue line. You can see that the price reversed its upward ascent immediately prior to reaching that blue line.
That segment of price activity is an example of a stock pullback.
Notice that the price of the stock then went up after the pullback occurred. That's certainly not guaranteed to happen with every pullback, but it's what some investors hope for when they buy companies that are experiencing a stock pullback.
How Can You Find a Pullback on a Stock Chart?
You can find a pullback on a stock chart by observing the price movements of the stock in relation to its overall uptrend line. Here are the steps to identify a pullback:
Examine the Price Chart
Look at the price chart of the stock. The most common pullbacks might be ones where each bar or candle represents one day of price activity, but stock pullbacks can occur on any time frame of stock chart.
Identify the Uptrend
Determine if the stock is in an uptrend, which is characterized by the price moving consistently higher over a period of time. In the chart, this is indicated by the center line of the price activity going from the bottom left of the chart to the top right.
Look for Dips
Watch for moments when the stock's price ascent slows down or comes down, but where the overall uptrend remains intact. These points are known as pullbacks.
Consider Using Keltner Channels
You can use the Keltner Channel, a technical indicator, to help quantify the strength of a pullback. The Keltner Channel consists of three lines on the chart, and when the stock's price has been in the Upper Keltner Channel for a while and then gets close to the middle line, it may indicate a pullback.
Look at this chart of Apple stock:
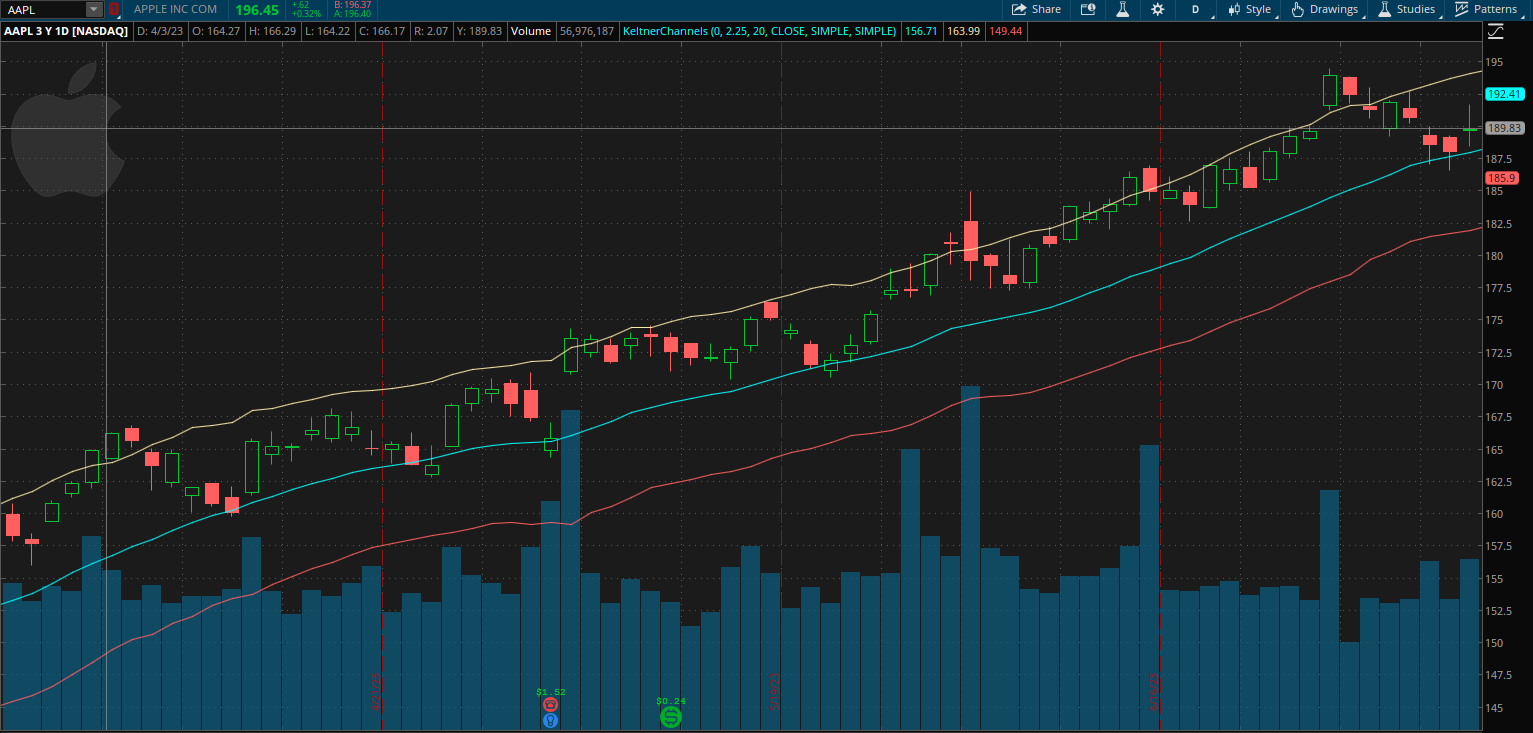
In this example, the stock price of Apple was in an uptrend, moving steadily higher and hanging out in the Upper Keltner Channel.
At certain points in the chart, the price slowed down, almost like it took a breather, and declined to the middle blue line of the Keltner Channel before continuing its upward trend.
This occurred multiple times in the chart, demonstrating multiple pullbacks during a sustained uptrend.
Video About Pullbacks
This video we made about Pullbacks might be helpful:
How to You Measure the Strength of a Pullback?
By using the Keltner Channel in conjunction with the price chart, traders and investors can quantify the strength and depth of a pullback and make more informed decisions regarding their trades or investments.
If the price of the stock has been in the Upper Keltner Channel for a sustained period, the pullback's magnitude can then be measured based on how far the stock's price dips towards the middle line or even below it.
A deeper pullback, where the stock's price moves significantly closer to or below the middle line, may indicate a more substantial decline in the stock's price during the uptrend.
How Can Investors Benefit from Pullbacks?
Pullbacks are sometimes thought of as ways to buy a strong stock for a discount. When someone says "buy low and sell high", a pullback comes to mind because it occurs when a stock is in an uptrend and exhibits a drop in price.
We put together a pullback trading strategy that you can consider. It offers precise entry and exit rules for the trade.
The challenge is that there is risk involved. There is no way to be certain exactly what will happen next in the stock market. So as much as a pullback may seem like a great investing opportunity, it certainly doesn't guarantee that it will work every time.
One thing that can help investors is know the track record of success for any given pullback opportunity. And that's where we can step in and help.
Our specialty at Stock Market Guides is doing stock market research. We've researched thousands of pullback trading strategies and found which ones had the best performance in backtests.
We took this information and create a service where we alert people when one of these pullback trades is setting up and inform them what the historical track record of success is in backtests for that trade setup.
Learning More About Pullbacks in the Stock Market
If you have any questions about pullbacks or anything else in the stock market, you can contact us any time and we'll be ready to help.
Join Our Free Email List
Get emails from us about ways to potentially make money in the stock market.
Stock Market Guides
You can trade without an edge, but why?
What We Offer
Stock Market Guides identifies swing trading opportunities that have a historical track record of profitability in backtests.
79.4%