Meaning of 52-Week High in the Stock Market
Stock Market Guides is not a financial advisor. Our content is strictly educational and should not be considered financial advice.
The 52-week high is a key term that you may often hear as you explore new stocks and trading strategies.
This article explores the meaning of a 52-week high, how to find the 52-week high of any stock, and how it can inform your next move in the market.
52-Week High Definition
There are 52 weeks in a year, and a stock’s 52-week high provides a point of reference about the price range of a stock over the last year.
As you look at the price activity of any stock, it can be helpful to see its range of price at any given time. It helps you understand how a stock’s current price relates to its performance over the last year.
Stock Market Guides
Stock Market Guides identifies stock and option trading opportunities that have a historical track record of profitability in backtests.
Average Annualized Return
43.1%
How to Identify a Stock's 52-Week High
Take a look at the daily stock chart for Amazon (AMZN) below. Each green or red price bar represents one day of price activity. This chart covers a period from May 8 on one year to May 8 the next year.
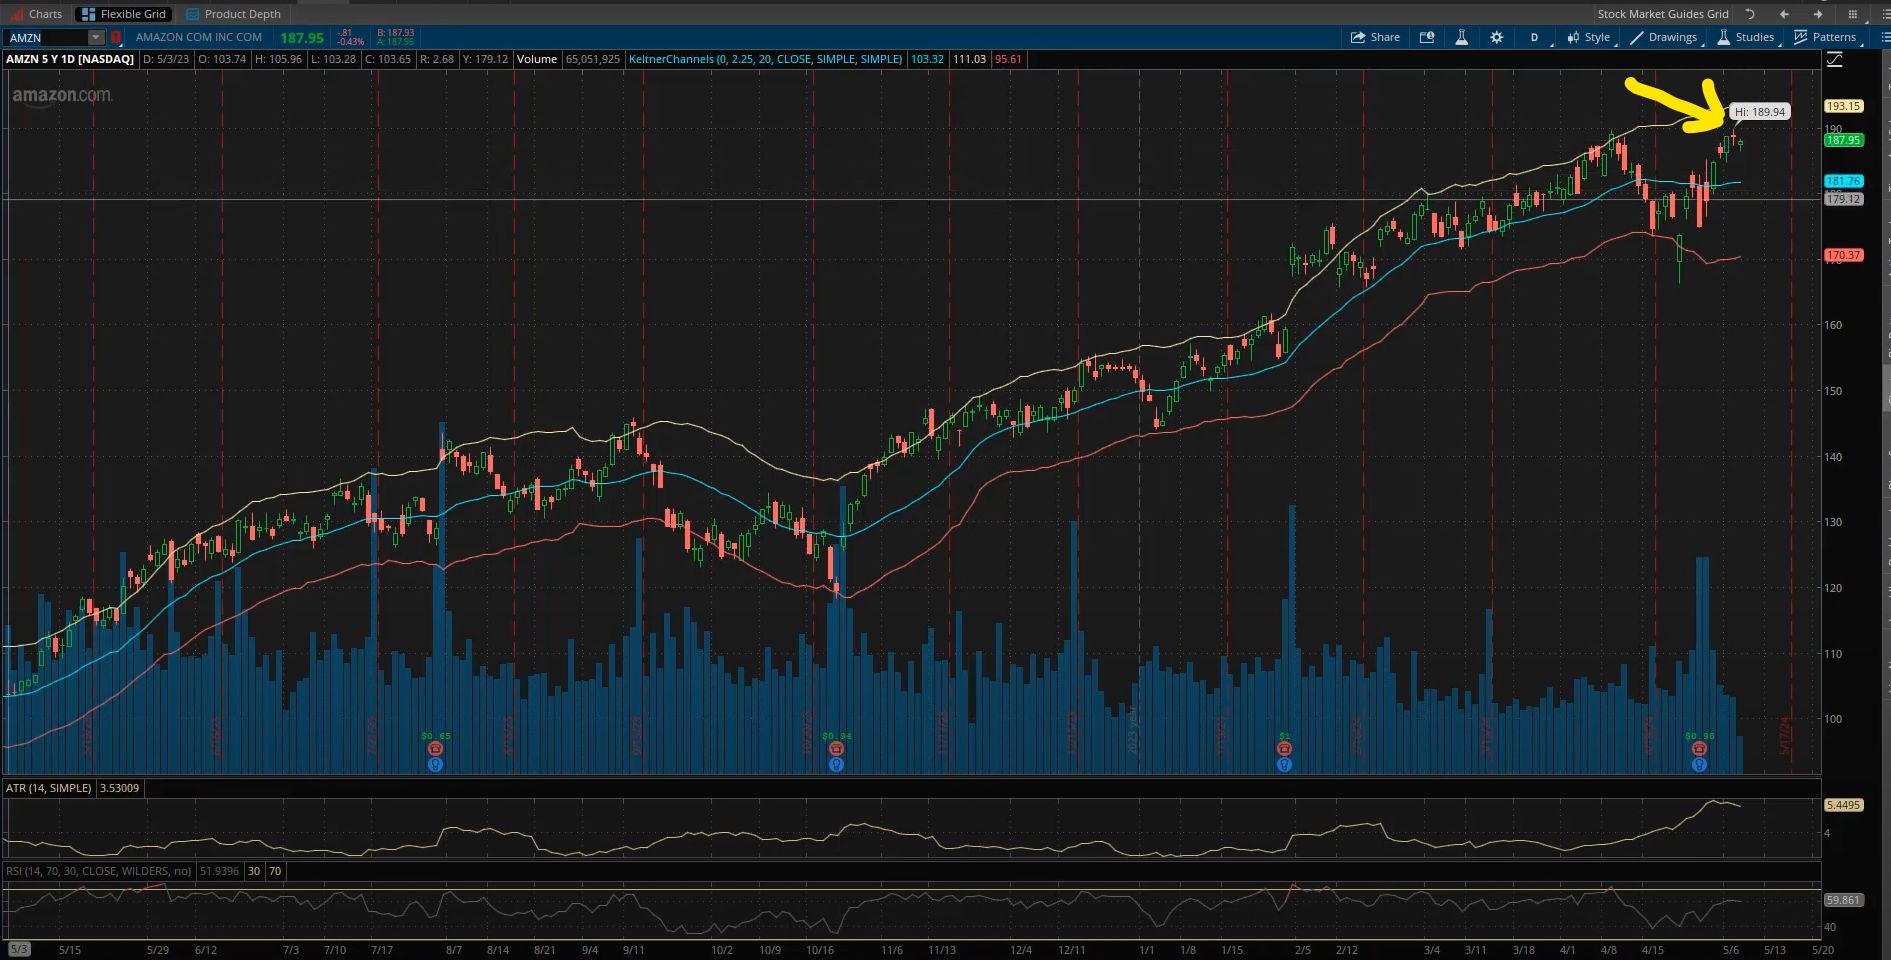
To find the 52-week high within this period, simply look for the highest price on the chart. In this example, the highest price was $189.94 on May 7th, as indicated by both the yellow arrow and the little indicator shown by the trading platform itself. No other prices are higher than that, making it the 52-week high.
For a visual walkthrough of how to identify a 52-week high on a daily stock chart, check out this video.
How the 52-Week High Can Help You
Depending on your strategy, the 52-week high may help you determine your next stock trade.
For example, a strategy some investors use is to buy low and sell high. Basically, if the price of the stock is close to its 52-week high, that may represent an opportunity to sell that stock if you're already holding it, or to short it since it's at a high point.
Alternatively, some investors might see a stock at its 52-week high as a signal that the stock could be bought since it might be in a upward trend.
Understanding the market and helping you make informed stock investing decisions is Stock Market Guides’ primary goal. We shine light on real-world data – specifically, historical data – and show you how given different investment opportunities have performed in the past.
For example, we look at stocks that reach their 52-week highs and evaluate how they performed historically at other times when they had hit 52-week highs. This way, when a stock meets that criteria, you can look at our data and determine for yourself whether or not the stock has offered profitable opportunities historically – and, if so, whether that’s something you want to act on.
How Do You Find Stocks at Their 52-Week Highs?
You can find them by using our 52-Week High scanner. It's a free tool we offer here at Stock Market Guides. It uses our proprietary scanning technology to find stocks are at their 52-week highs.
Here's how the scanner results look:
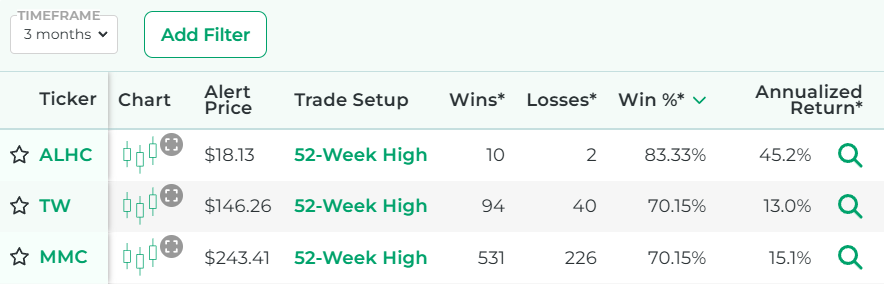
That tool ensures that you don't have to waste time flipping through stock charts manually to find stocks at their highest price in the last year.
How Well Does Buying 52-Week High Stocks Actually Work?
The idea of a trading strategy of buying stocks at their 52-week highs sounds nice to many people because it offers a clear, easy-to-understand way to find a trade setup.
But does it actually work? Can traders indeed generate profits by doing that?
That's exactly what our company can help answer for you, since our scanner technology has allowed us to do our own research on that precise question.
The answer is that trades based on 52-week highs are not always profitable, but many times they are. For certain stocks, they might have a particularly strong track record of success according to our backtest research.
Here is some data that shows how a proprietary 52-week high trading strategy we created has performed historically according to backtests:
Wins
---
Losses
---
Win Percentage
---
Annualized Return
---
Anyone who signs up for our stock investing scanner service will be able to see stocks that qualify for that trading strategy in real time.
Learn More About 52-Week Highs in Stocks
If you have questions about 52-week highs, or anything else related to the stock market, contact us any time. You can also check out our services to see how stocks have performed historically when nearing their 52-week highs to inform yourself prior to making your next investment decision.
Join Our Free Email List
Get emails from us about ways to potentially make money in the stock market.
Stock Market Guides
You can trade without an edge, but why?
What We Offer
Stock Market Guides identifies stock and option trading opportunities that have a historical track record of profitability in backtests.
Average Annualized Return
43.1%