How to Read an Options Chain
Stock Market Guides is not a financial advisor. Our content is strictly educational and should not be considered financial advice.
If you're thinking about trading options in the stock market, then at some point you'll likely need to learn how to read an options chain.
The reason is that an options chain is the mechanism for showing investors which options are available for any given ticker symbol in the stock market.
The problem is that it's not exactly easy to read an options chain, especially when you're looking at one for the first time. It can seem like an overwhelming mountain of data.
The good news is that once you understand the general principles for how they're laid out, you might realize that they are not as complicated as they first seem.
This guide will teach you how to read an options chain with pictures and a video.
What Exactly Is an Options Chain?
An options chain is a visual representation of all available options contracts for a particular stock. It displays information in columns, including expiration dates, strike prices, option types, and prices.
They are typically made available by brokerages. Most brokerages that cater to options traders have an options chain available either on their website or in their trading platform.
Here is an example of what an options chain looks like in the Thinkorswim trading platform:
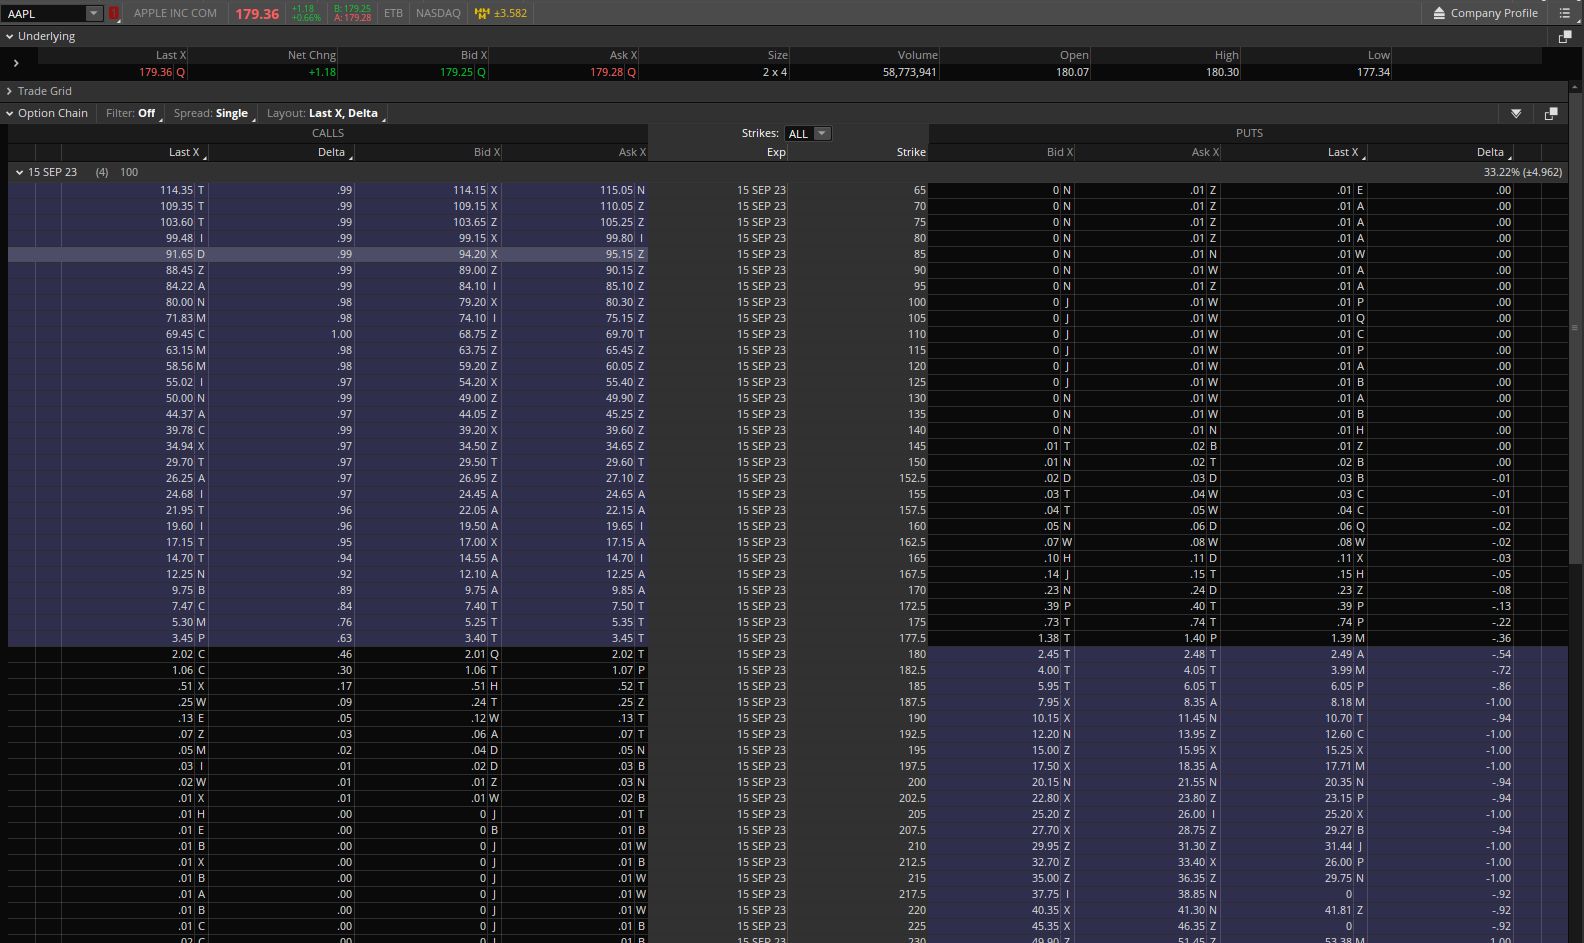
Once you know how to read it, it can take you just a matter of seconds to find what you need for any given trade.
Stock Market Guides
Stock Market Guides identifies option trading opportunities that have a historical track record of profitability in backtests.
Average Annualized Return
150.4%
How Are Options Chains Divided?
A key to learning how to read an options chain is to understand how they are divided. These are key elements to be aware of:
-
Stock Ticker Symbol: You won't find two stock ticker symbols in the same options chain. Normally any given option chain represents just one underlying stock.
-
Expiration Date: Options have expiration dates, and many times the options chains will be divided up by expiration dates. That means if you're looking at a particular options chain grid, normally that grid all represents just one single expiration date.
So that means when you see any given options chain, it's normally for just one specific expiration date and for just one particular underlying stock.
Here is how the information on the options chain itself is divided:
Strike Prices: Center Column Axis
The center column of the options chain can be thought of as an axis for the table. The information to the left and right of that column is anchored to it.
That center column typically shows the strike prices available for that expiration date's series of options.
In the image below, you can see that the center column has a gray background and indicates the strike prices available for Apple options with a September 15 expiration date:
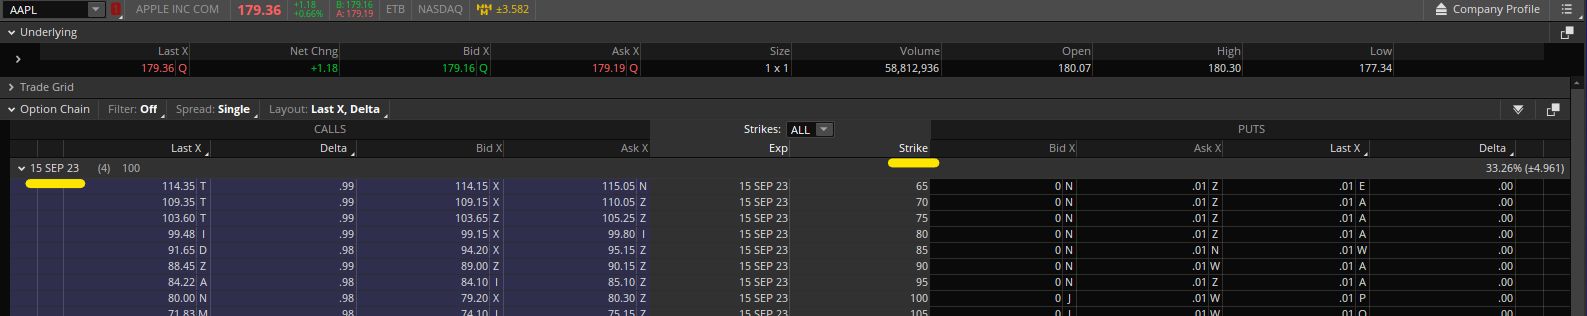
There are two yellow lines. One is underneath the Strike column. The other is underneath the expiration date for that options chain.
Many times, the option chain can be edited to show a different number of strike prices. By default, many options chains only show a handful of strike prices since it can be overwhelming to see them at once. You can look for a way to edit which strike prices are shown if you want to see more or less strike prices in your options chain.
Call Options: Left Side of Options Chain
On the left side of the options chain, you'll see all the call options available for that particular expiration date's series of options.
They're organized by the strike prices that are found in the center column.
Put Options: Right Side of Options Chain
On the right side of the options chain, you'll see all the put options available for that particular expiration date's series of options.
They're also organized by the strike prices that are found in the center column.
You can see in the image below how the call options are on the left side and the put options are on the right side:
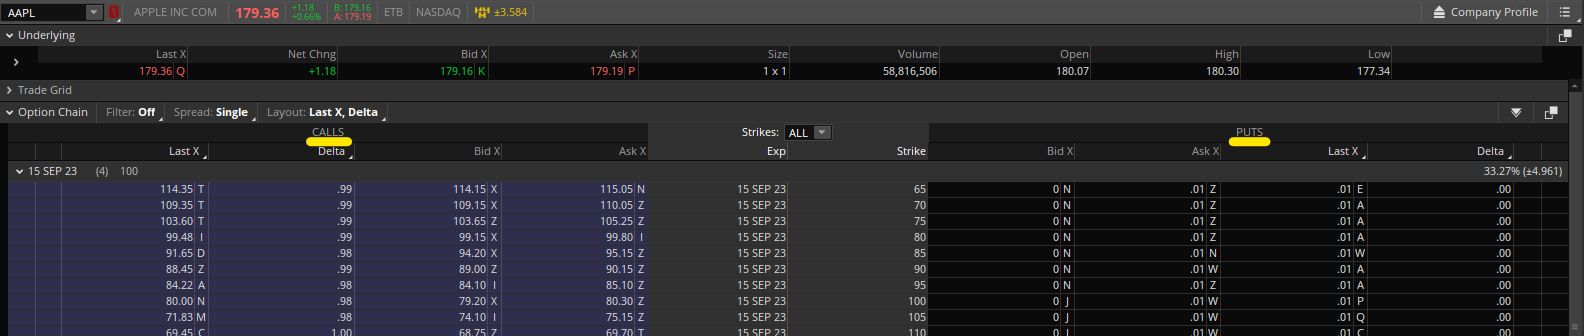
Notice the yellow lines that are right underneath the terms "Calls" and "Puts."
Information Shown in the Options Chain
Not every options chain is the same when it comes to which information is displayed for each option.
The most relevant information is typically price, and most options chains do display that. It can be shown in the form of the last price or in the form of the current bid and ask prices.
There are other types of information about each options that might be visible in an options chain. Volume, open interest, implied volatility, and Greek values are some examples.
Some options chains allow you to edit which information is displayed for each option. If that's the case, then you can pick and choose the data points that are most relevant to you.
It might help to see some of these ideas in action. This is a video we made that shows how to read an options chain:
In-The-Money vs. Out-Of-The-Money on the Options Chain
Some options chains offer some sort of visual representation of which options are in the money vs. out of the money.
If we look again at the example from above of the options chain, you can see that difference:
The in-the-money options have a navy blue background, while the out-of-the-money options have a black background.
Many options chains offer similar visual cues that make it easier to distinguish them.
Buying Options from an Options Chain
Many brokers offers a way to trade options directly from the options chain.
What's nice is that by doing that, your order form is normally auto-filled with all the relevant option information.
In the case of Thinkorswim, you can mouse over the row of the option you want, which causes the row to be highlighted. Then you right click it and follow the menu prompts to set up your order.
In some other trading platforms, they have a column with a Buy or Sell link that you can click to initiate a trade.
Determining Which Options to Buy
We offer two services here that are designed to help people find option trades to consider.
Our option trading scanner service finds live trade setups that have a backtested edge. You can review the scan results to research option trading opportunities.
Our option trade alerts service does the work for you and delivers option picks directly to you.
Learning More About Options Chains
You can contact us any time if you would like to ask any questions about options chains, or about anything related to trading in general.
Join Our Free Email List
Get emails from us about ways to potentially make money in the stock market.
Stock Market Guides
You can trade without an edge, but why?
What We Offer
Stock Market Guides identifies option trading opportunities that have a historical track record of profitability in backtests.
Average Annualized Return
150.4%