Double Bottom Chart Pattern - How It Works and How Traders Can Use It
Stock Market Guides is not a financial advisor. Our content is strictly educational and should not be considered financial advice.
When it comes to the stock market, sometimes you might hear the term "double bottom" mentioned. It refers to a stock chart pattern that is popular among active stock traders.
This article will explain what a double bottom chart pattern is and how traders might be able to benefit from using it.
What Exactly Is a Double Bottom?
A double bottom occurs after a downtrend in price and is characterized by a stock chart having two consecutive troughs at approximately the same price level. That price level is referred to as a support level.
When you look at it on a stock chart, a double bottom looks like the letter "W". The price bars are patterned in such a way that there are two troughs with a peak in the middle.
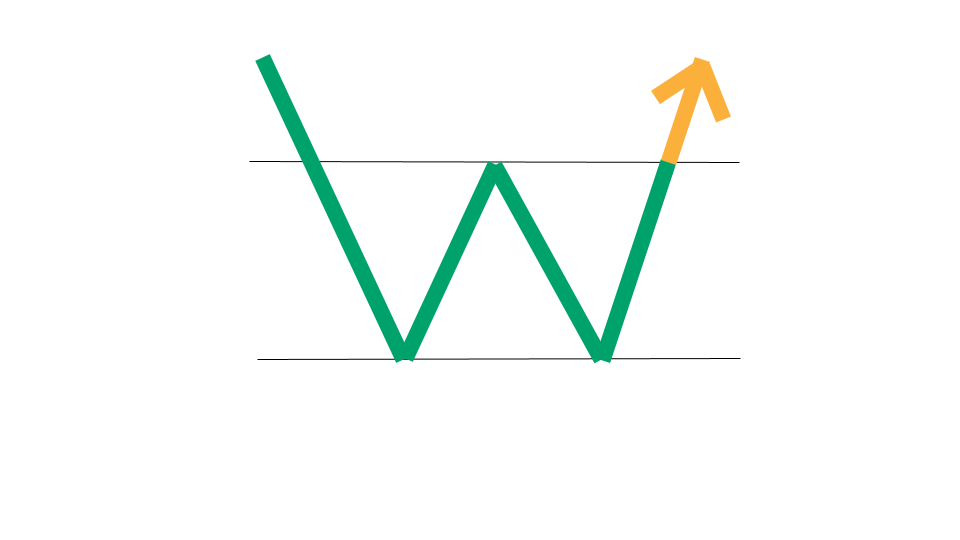
That image is a graphical icon that gives an idea visually of what a double bottom chart pattern looks like.
Stock Market Guides
Stock Market Guides identifies swing trading opportunities that have a historical track record of profitability in backtests.
Average Annualized Return
79.4%
What Does a Double Bottom Look Like On A Stock Chart?
The image below is an example of a double bottom pattern as shown on one of our stock charts.
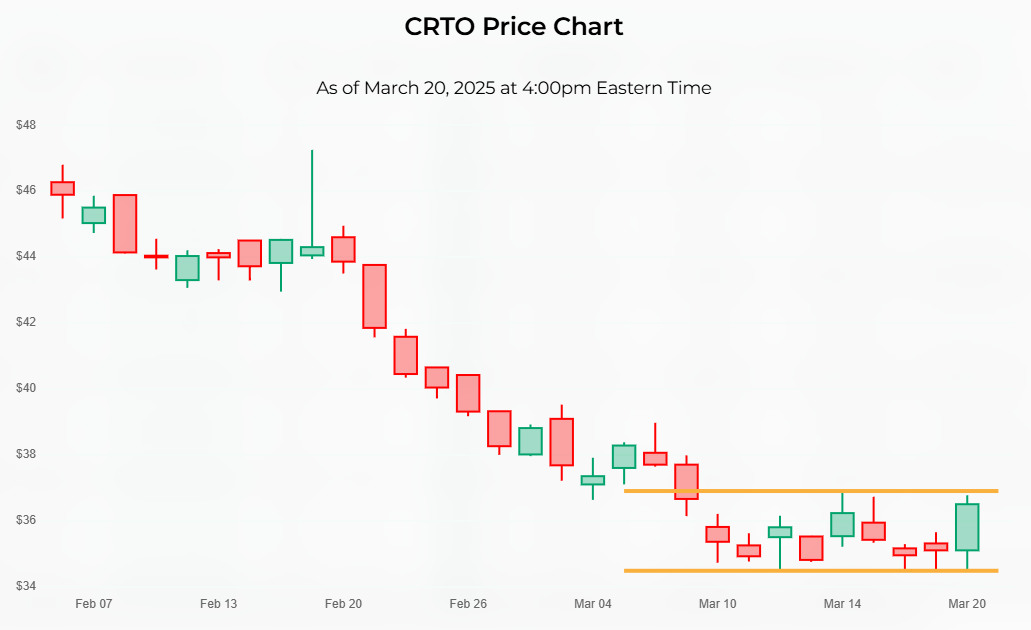
There are golden lines on our charts that automatically outline chart patterns when they're detected.
You can see how there are two distinct price troughs at around the same price level, with a price peak in between them. In this particular chart, the troughs are more rounded than a classic "W" shape, but they still meet the criteria of a double bottom pattern.
How Do Traders Use a Double Bottom?
The logic behind this pattern is that the price is testing a support level, indicated by the price where the two troughs are.
Many traders consider a double bottom pattern as a signal to buy. The idea is that since the price has touched the support level twice without breaking below it, there may be strength at that level.
A trader might consider buying the stock after the stock has formed the second trough of the pattern in anticipation of an ongoing price rebound.
Alternatively, a trader might wait for the price to rebound past the price peak between the two troughs before buying the stocks. The idea here is that the trader is waiting for confirmation that the price rebound will surpass the potential resistance level of the price peak.
Is a Double Bottom Bullish or Bearish?
Double Bottoms are generally considered bullish chart patterns, meaning that the presence of a double bottom on a stock chart might be an indication that the stock price is on the verge of going up.
Since a double bottom is typically considered bullish, it means traders might try to capitalize by going long (meaning that they would be buying instead of shorting).
How Do You Find Stocks That Have Double Bottom Patterns?
You can find them by using our Double Bottom scanner. It's a free tool we offer here at Stock Market Guides. It uses our proprietary scanning technology to find stocks that are in a double bottom chart pattern.
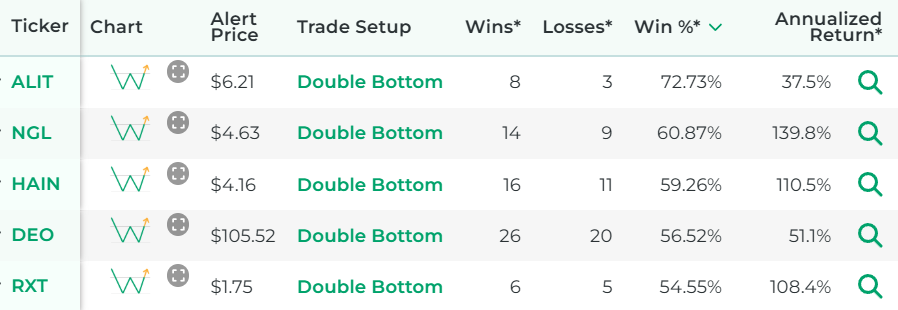
Here's how the scanner results look:
That tool ensures that you don't have to waste time flipping through stock charts manually to find stocks with a double bottom pattern.
Video About Double Bottom Pattern
Here's a video that explains the double bottom chart pattern and gives examples:
Example of a Double Bottom Trading Strategy
For this example of a double bottom trading strategy, we're going to use a daily chart, where each price bar represents one day of price activity. That means it would be a swing trading strategy where the trade is designed to last more than one day but not for the long haul.
Entry for the Double Bottom Trading Strategy
The entry for this Double Bottom trading strategy will be as follows:
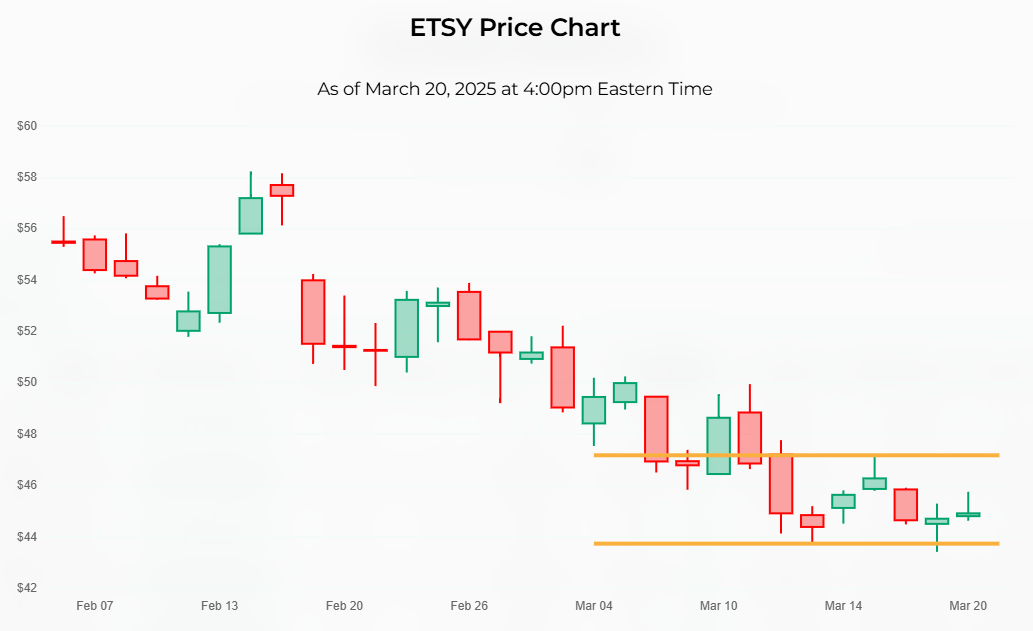
The entry criterion for our Double Bottom trading strategy is very simple. You can see in the stock chart below for Etsy that the entry price would be right around $47, where that upper golden line is.
Exit for the Double Bottom Trading Strategy
There are a lot of possibilities here for the exit.
One benefit of using a stock chart pattern as a basis for making trades is that the pattern itself can help you determine exits in some cases.
For any given trading strategy, it can be helpful to define three different criteria for the exit: profit target, stop loss, and time limit.
Not everyone uses all three, and that's totally fine. Ultimately, you can set these values however you want. But for the purposes of this strategy example, we will define all three:
- Profit Target
We will set the profit target at 2 ATRs away from the entry price.
ATR is an indicator in the stock market that measures a stock's recent price volatility. Most trading platforms have it available as an indicator you can enable.
Our profit target criterion indicates that we will take the ATR value of the stock, multiply it by two, and add it to the price we paid when we bought the stock. That will be our profit target and we can set up a sell limit order at that price.
- Stop Loss
We will set the stop loss at 0.5 ATRs below the support line (the lowest price of the troughs of the double bottom). This means we take the ATR value of the stock, multiply it by 0.5, and subtract it from the support level price from that day.
That will be our stop loss and we can set up a stop order at that price.
- Time Limit
We will set the time limit as one week since this is a swing trade. If the stock has not hit either the profit target or stop loss by the time limit, then we will close the trade manually at the opening bell seven calendar days after entry.
How Well Do Double Bottoms Actually Work?
The idea of a double bottom trading strategy sounds nice to many people because it offers a clear, easy-to-understand way to find and manage a trade setup.
But does it actually work? Can traders indeed generate profits by trading double bottom chart patterns?
That's exactly what our company can help answer for you, since our scanner technology has allowed us to do our own research on that precise question.
The answer is that trades based on a double bottom are not always profitable, but for certain stocks they might indeed have a track record of success according to our backtest research.
Here is some data that shows how a proprietary double bottom trading strategy we created has performed historically according to backtests:
Wins
---
Losses
---
Win Percentage
---
Annualized Return
---
Anyone who signs up for our swing trading scanner service will be able to see stocks that qualify for that trading strategy in real time.
Learning More About Double Bottoms
You can contact us any time if you would like to ask any questions about double bottoms or anything else related to the stock market.
Join Our Free Email List
Get emails from us about ways to potentially make money in the stock market.
Stock Market Guides
You can trade without an edge, but why?
What We Offer
Stock Market Guides identifies swing trading opportunities that have a historical track record of profitability in backtests.
Average Annualized Return
79.4%