Stock Chart Patterns
Learn stock chart patterns here and access our free scanner that shows which stocks exhibit these chart patterns right now. You'd have to upgrade to our paid service to see the historical backtested performance of the chart patterns for each stock.
Chart Pattern Quick Guide


To get alerts when stocks exhibit any of these chart patterns, you can sign up for our Swing Trading Service.
Detailed List of Chart Patterns
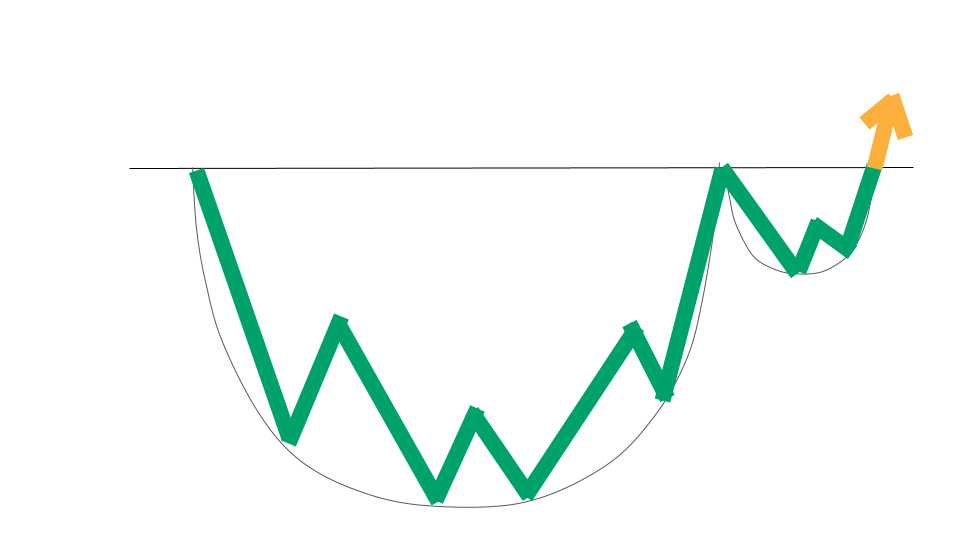
Cup and Handle Pattern

Look of the Pattern:
The shape of the chart looks like a teacup. There are three distinct points where the price "tops out" at a resistance line, forming a cup and handle appearance.
Finding Stocks With This Pattern:
You can see which stocks are in this pattern today by using our Cup and Handle scanner.
Bull Flag Pattern
Look of the Pattern:
The Bull Flag pattern is one that looks like a flag that is slanted to the right. The long green line on the left is like the flag pole, and the thin black lines demonstrate the edges of the flag.
Finding Stocks With This Pattern:
You can see which stocks are in this pattern today by using our Bull Flag scanner.
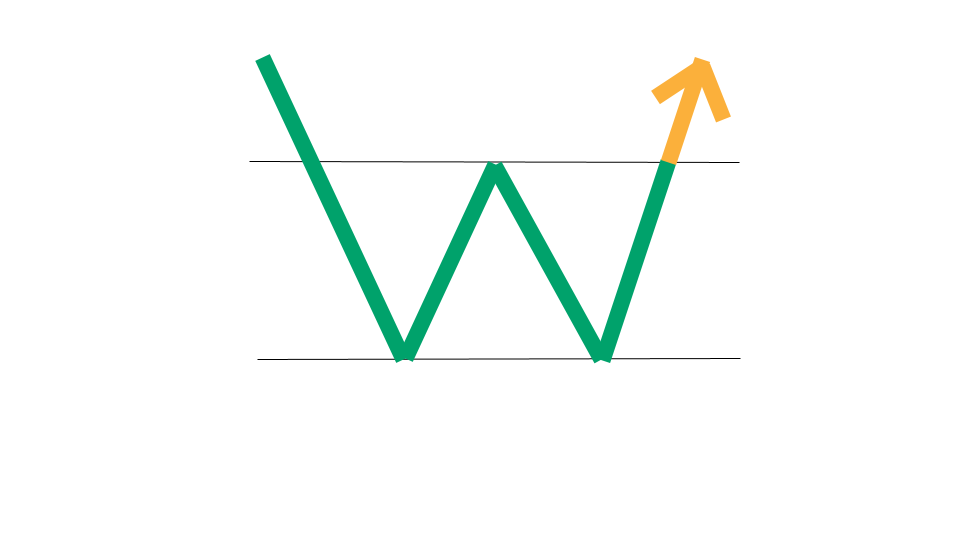
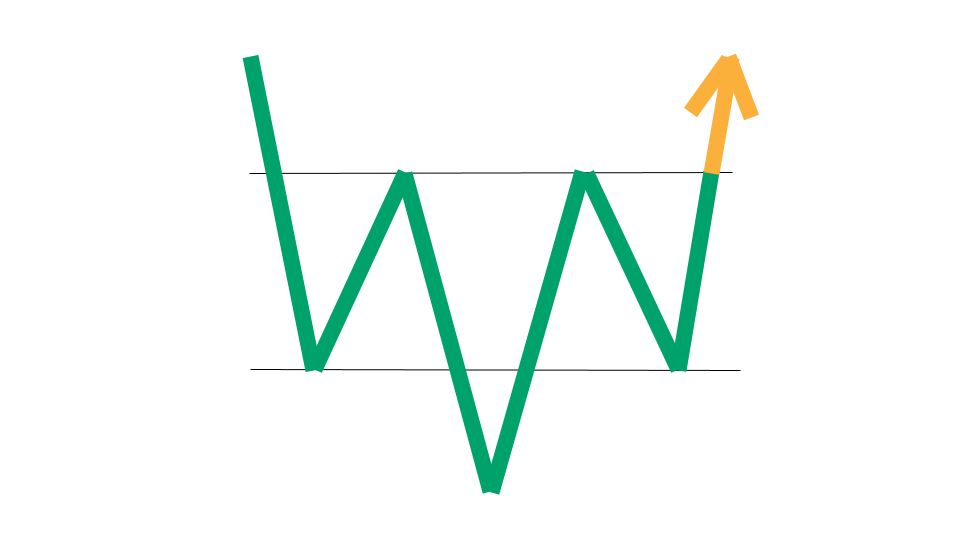
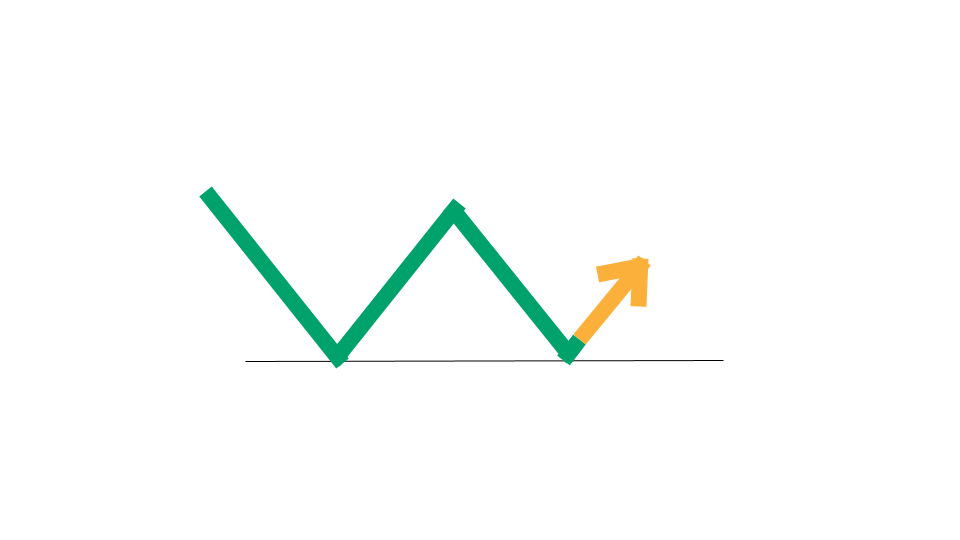
Double Bottom Pattern

Look of the Pattern:
The Double Bottom chart pattern is one where the stock has hit a support level two separate times and is rebounding upward. It looks like a "W" shape.
Finding Stocks With This Pattern:
You can see which stocks are in this pattern today by using our Double Bottom scanner.
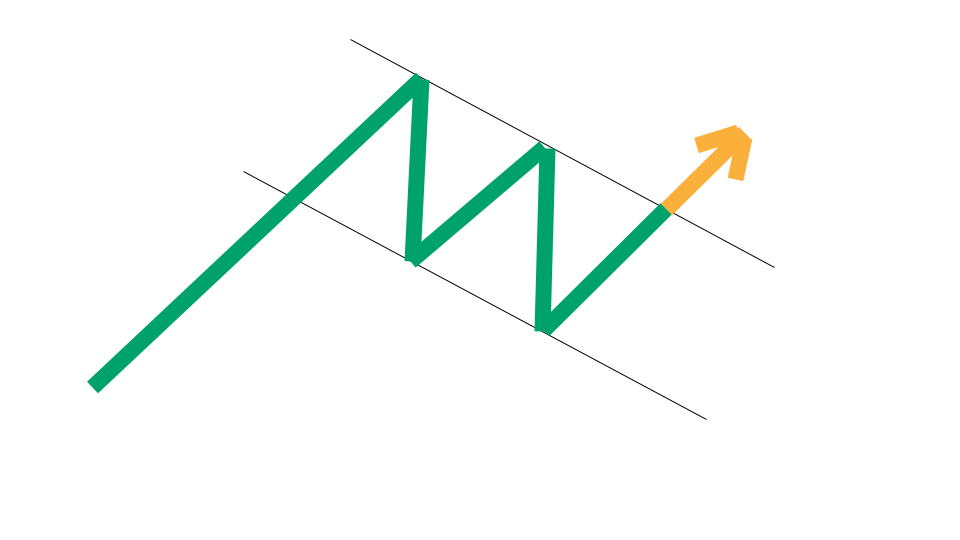
Falling Wedge Pattern

Look of the Pattern:
The Falling Wedge pattern is one that looks triangular, where the price is bouncing between two lines, both of which are descending.
Finding Stocks With This Pattern:
You can see which stocks are in this pattern today by using our Falling Wedge scanner.
Inverse Head and Shoulders Pattern
Look of the Pattern:
Th inverse head and shoulders pattern looks a bit like a person's head and shoulders upside down. The shoulders are pointy, though, and the head isn't necessarily rounded.
Finding Stocks With This Pattern:
You can see which stocks are in this pattern today by using our Inverse Head and Shoulders scanner.
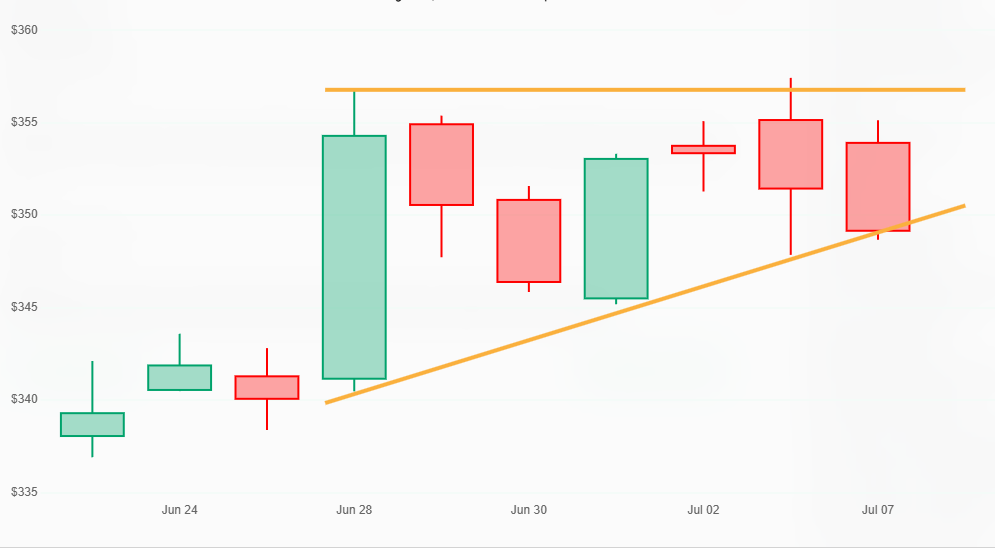
Ascending Triangle Pattern
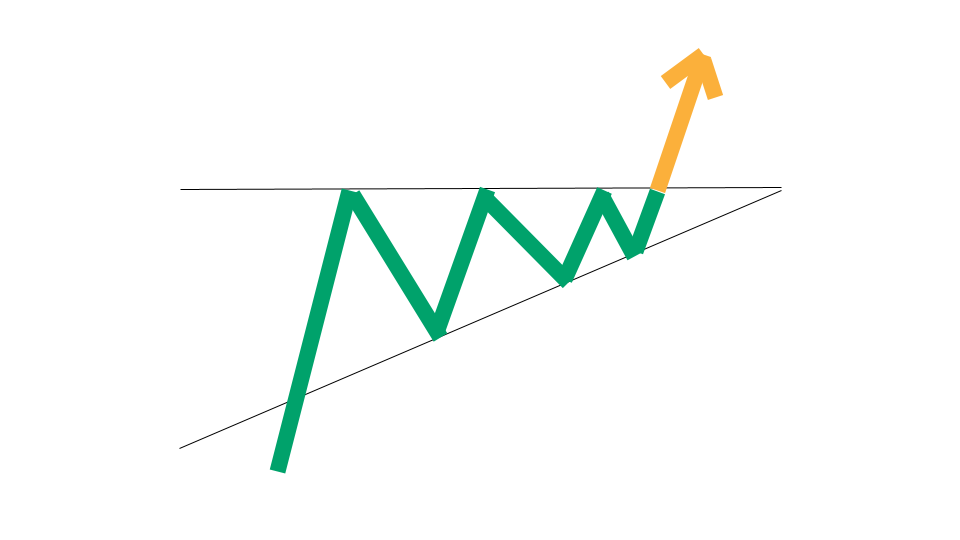
Look of the Pattern:
The ascending triangle pattern has the shape of a triangle where the top line of the triangle is flat and represents resistance, and there is an upward sloping lower line of the triangle.
Finding Stocks With This Pattern:
You can see which stocks are in this pattern today by using our Ascending Triangle scanner.
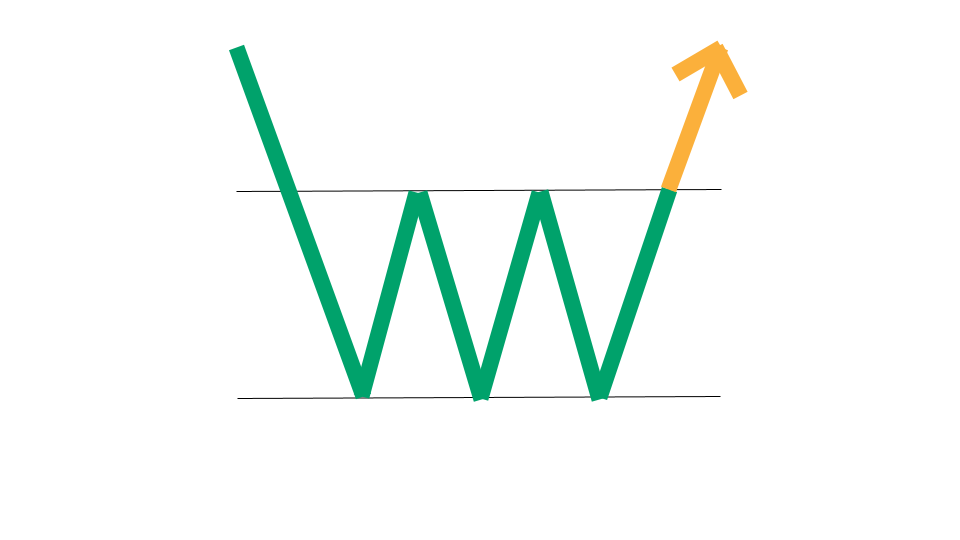
Triple Bottom Pattern

Look of the Pattern:
The Triple Bottom Pattern looks a lot like its Double Bottom sibling, except with one extra leg added to the "W" shape.
Finding Stocks With This Pattern:
You can see which stocks are in this pattern today by using our Triple Bottom scanner.
Wedge Pattern
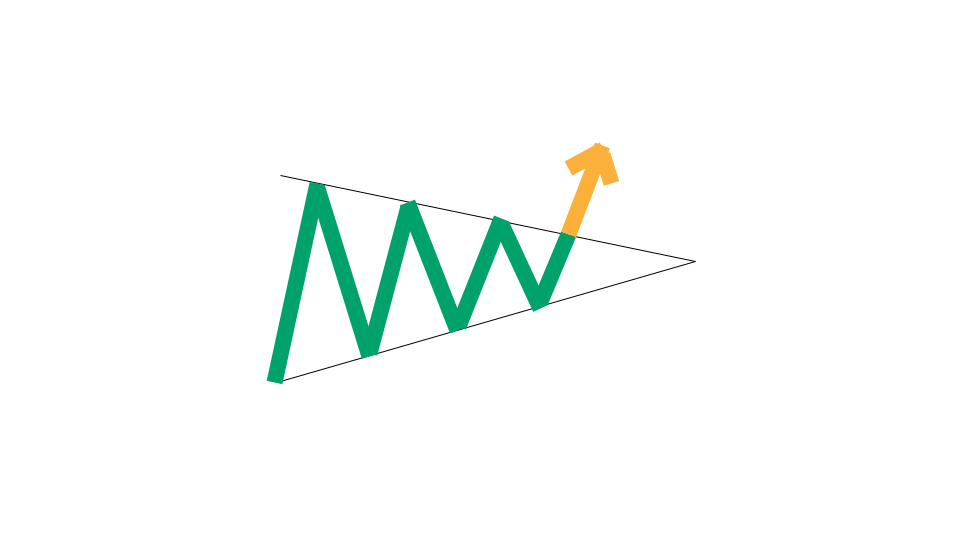
Look of the Pattern:
The Wedge Pattern has the shape of a triangle where the top line of the triangle is flat and represents resistance, and there is an upward sloping lower line of the triangle.
Finding Stocks With This Pattern:
You can see which stocks are in this pattern today by using our Wedge scanner.
Top Breakout Stocks
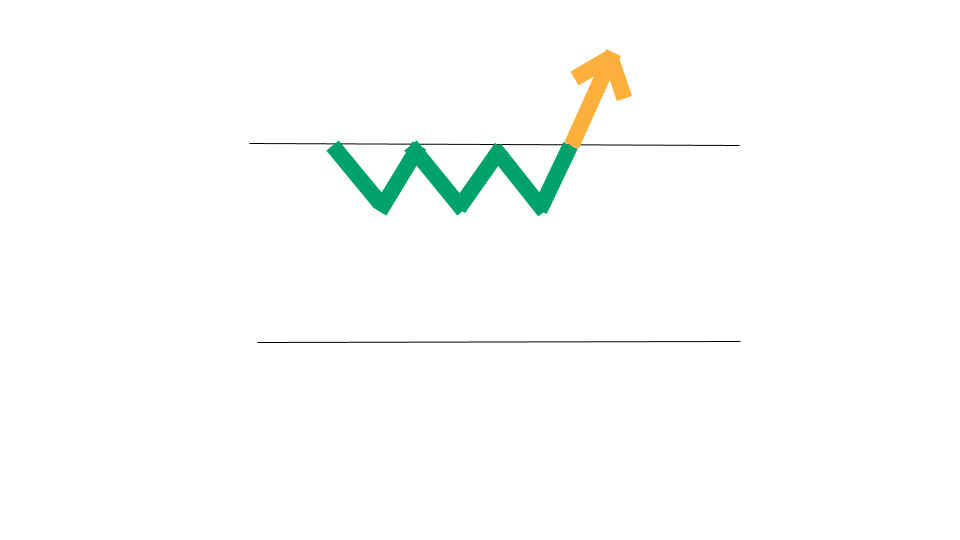
Look of the Pattern:
Stocks that are up against a resistance level and finally break through are considered breakout stocks. Breakout patterns can take many shapes.
Finding Stocks With This Pattern:
You can see which stocks are in this pattern today by using our Top Breakout Stocks scanner.
Channel Pattern
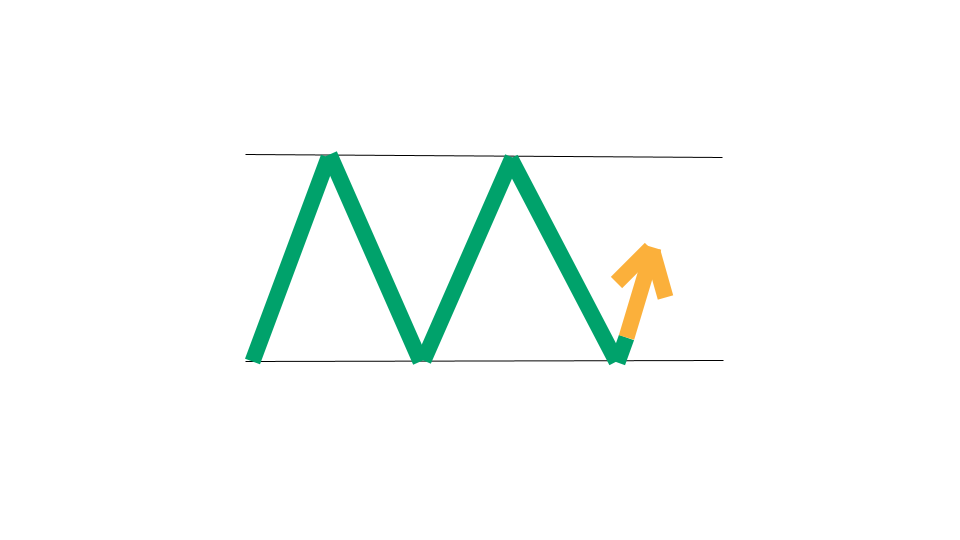
Look of the Pattern:
Stocks in a Channel Pattern are also referred to as stocks in a range. They are stocks whose prices are bound between a support level and a resistance level.
Finding Stocks With This Pattern:
You can see which stocks are in this pattern today by using our Channel Pattern scanner.
Bullish Pennant Pattern
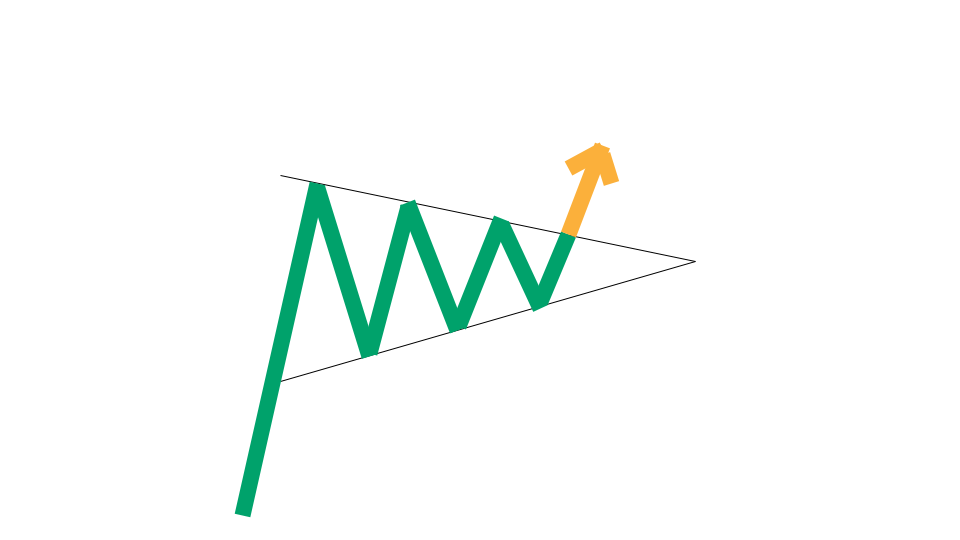
Look of the Pattern:
A Bullish Pennant pattern looks just like a Wedge pattern, except with a flagpole on the left hand side.
Finding Stocks With This Pattern:
You can see which stocks are in this pattern today by using our Bullish Pennant scanner.
Stocks at Support
Look of the Pattern:
Stocks are said to be at support if they are near a support level. There might be extra buying pressure to propel the stock at a support level.
Finding Stocks With This Pattern:
You can see which stocks are in this pattern today by using our Stocks at Support scanner.
Uptrending Stocks
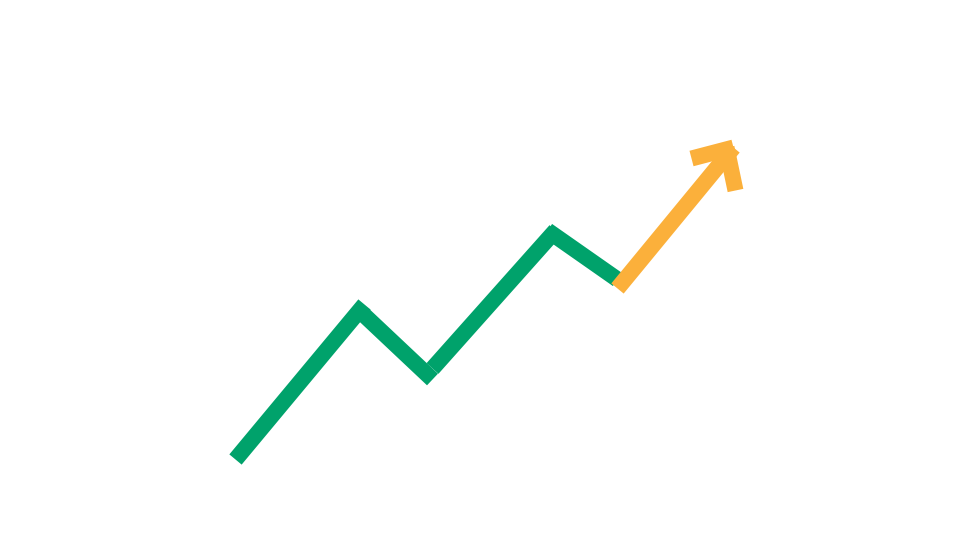
Look of the Pattern:
As stock exhibiting an uptrend is one that has a rising stock price. Uptrends can have different durations.
Finding Stocks With This Pattern:
You can see which stocks are in this pattern today by using our Uptrending Stocks scanner.
To get alerts when stocks exhibit any of these stock chart patterns, and to see how they performed historically in backtests for each stock, you can sign up for our Swing Trading Service.
Chart Pattern Scanner
Our Swing Trading Service includes access to our proprietary swing trading scanner technology. Our chart pattern scanner identifies trade opportunities that have a backtested edge. Here at Stock Market Guides, our specialty is bringing data and statistics to your trading decisions. With every stock trade setup that comes up in our chart pattern scanner, you’ll be able to see exactly how that trade setup has performed historically in backtests. This allows traders to make fully informed trading decisions. There’s no longer a need to take a blind leap of faith when making a stock trade.
How Our Chart Pattern Scanner Works
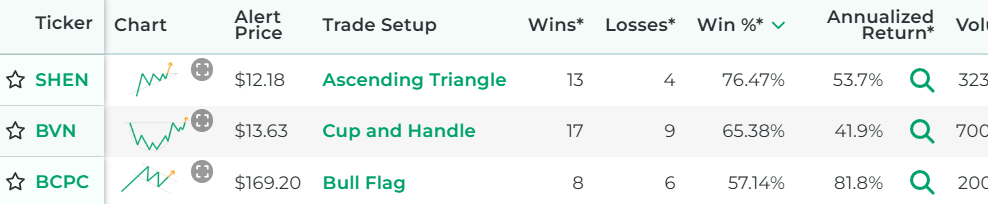
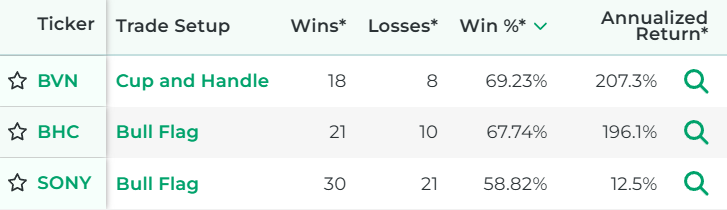
Here’s an example of what the results look like from our chart pattern scanner. You can see that each scan is reflects a specific swing trading strategy base on a stock chart pattern. Each scan result shows not only the stock, but also how the stock performed historically for that trading strategy according to our backtest research.
Features of Our Chart Pattern Scanner
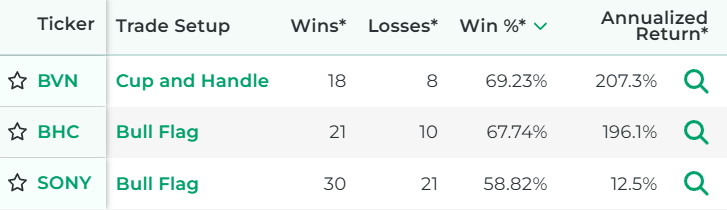
Shows Historical Performance
What makes our stock scanner one-of-a-kind is that each scan result shows how that stock performed in backtests when the chart pattern occurred in the past. Why waste time or money considering chart patterns that don’t have a track record of success?
Gives Complete Trade Setups
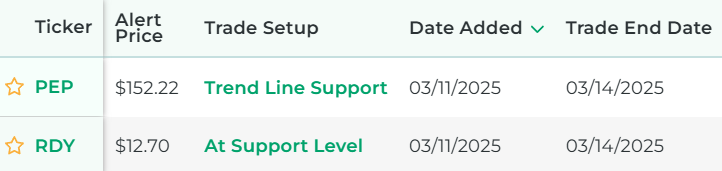
Each scan result offers a full trade setup based on the chart pattern our scanner identified. It gives you a specific amount of time to hold the position. This takes the guesswork out of your trading decisions. You know exactly how long to hold the position.
Get Alerts for New Scan Results
If you pay for our service, then you can enable alerts for any chart pattern scans you want. This means you will get alerted each time our scanner finds new stock chart patterns that have a backtested edge. Alerts can be sent by email or text. You can set your preference after you sign up for the service.

Our Stock Charts Show Trend Lines for Patterns
Each time a scan result comes up for any given chart pattern, you'll be able to see a stock chart that shows the trend lines for the pattern. This helps you visualize the pattern for that stock and might make it easier to decide how to manage a trade based on it.
- Find Stock Trade Setups That Have a Backtested Edge
- Has DIY Swing Trading Scanner
- Get Swing Trade Picks from Our Scanner: 79.4% Average Annualized Return in Backtests
FAQs about Stock Chart Patterns
Here are frequently-asked questions about stock chart patterns and why they might be important to investors.
What exactly is a stock chart pattern?
A stock chart displays the historical price movements of a stock, and a stock chart pattern refers to a distinct and recognizable formation of those price movements.
What is an example of a stock chart pattern?
Many stock chart patterns have well-known names such as 'Head and Shoulders," "Double Bottom," and "Bull Flag." This image is an example of a Cup and Handle chart pattern.

Why do stock chart patterns matter?
A stock chart shows a stock's price and can be seen as a reflection of buying and selling pressure for a stock. When the price fluctuates in a way that depicts a particular pattern, it means that the buying and selling pressure might give us insights about where the stock price is headed next. This information can be used to potentially profit from buying or selling the stock. Chart patterns are especially popular among active traders, such as swing traders.
How can you use stock chart patterns to make trading decisions?
What's nice about stock chart patterns is that each one has its own rules for what constitutes the pattern and also what would trigger a "buy" signal. So in other words, the pattern itself dictates the trade parameters. As a result, stock chart patterns in and of themselves make it relatively easy to determine when it's time for a trading decision. The challenging part is that not all chart patterns are created equal. Some perform better than others, and some stocks in particular have a good track record with particular chart patterns. That's the piece oft he equation that we put at your fingertips with our paid service. We show you the backtested performance of each chart pattern.
Which are the best stock chart patterns?
Perhaps the best chart patterns are the ones that have the strongest track record of success. If you sign up for our service, you'll see the historical backtested performance of each stock chart pattern in real time as it occurs. This might help you decide which chart patterns are worth taking action on.
How do you know if a chart pattern is bullish or bearish?
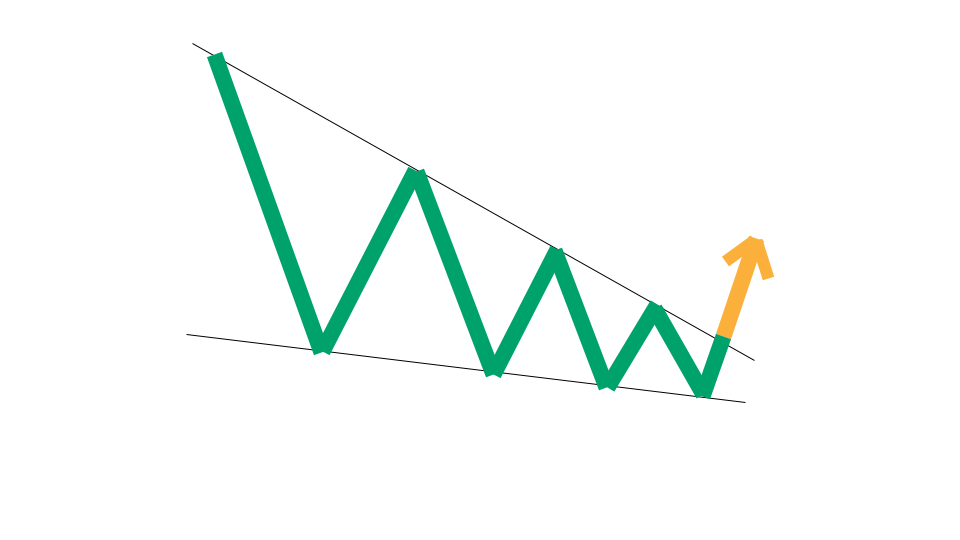
For each stock chart pattern, we have an image that depicts what the chart pattern looks like. In that image, there is a golden arrow. If that arrow is pointed upward, as you see in this image, then it means the chart pattern is bullish. If that arrow is pointed downward, it means the chart pattern is bearish.
As Seen On


Customer Testimonials
The service you provide appears to be exactly as advertised. Without exaggeration, thus far your service has cut my research time by at least 35% - 40%. Regards from a happy user.
Dennis from Florida
I'm making money, that's what matters. Well worth the $70 per month. I hope to, and plan to, use your service for as long as you'll have me.
James from Alabama
I've been really enjoying the service so far. It's super easy to follow the trades and learn the strategies.
Nader from Colorado
Absolutely love your service. I've found your service to be excellent and will recommend it.
Jason from California
Join Our Free Email List
Get emails from us about ways to potentially make money in the stock market.