Meaning of Downtrend in the Stock Market
Stock Market Guides is not a financial advisor. Our content is strictly educational and should not be considered financial advice.
Downtrends in the stock market are common, and being able to identify them will help inform your trading strategies.
This article explores the definition of downtrends, how to identify a downtrend on a stock chart, and how it could inform your future investment decisions.
Downtrend Definition
Downtrend is a simple yet important term that will help you navigate the stock market.
Stock Market Guides
Stock Market Guides identifies stock and option trading opportunities that have a historical track record of profitability in backtests.
Average Annualized Return
43.1%
Example of a Downtrend
Let’s illustrate a downtrend with a stock chart for Amazon (AMZN) below. A downtrend is visible as a chart pattern on a stock chart.
If you lean back and take a look at the chart as a whole, you can see that the price is going down over time. The price generally starts at the top-left, and it ends at the bottom-right: trending downwards.
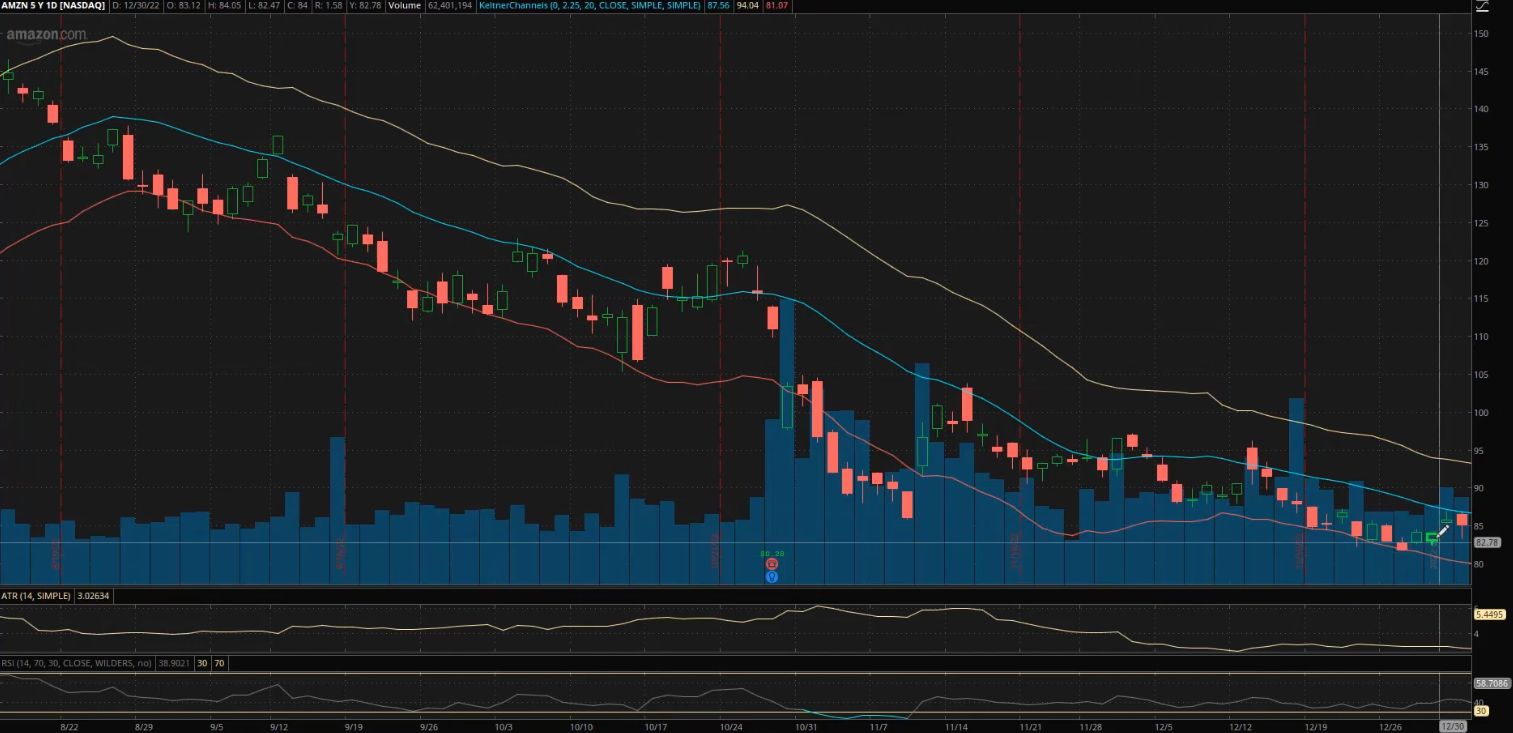
Simply put, that is what a downtrend looks like. However, there are several ways to identify a downtrend over various periods of time.
For example, take another look at the price bars in the example above. Each price bar represents one day of price activity, spanning from August to December, a four-month period.
You could say a stock is trending down for just a one-week period, or you could look at just one day’s price activity. At a more granular level, even minute-by-minute activity, you may find a downtrend.
How to Identify Stocks in a Downtrend
While you can simply look at a chart and identify a downtrend by seeing price activity start at the top-left and end at the bottom-right, there are more defined ways to identify these trends, too.
One way to identify a downtrend is by using a Keltner channel. The Keltner channel is made up of the three lines you see on a stock chart: red, blue, and tan.
To identify a downtrend with a Keltner channel, first take a look at the price activity: the little bars indicating price changes. In a downtrend, those price bars generally fall in the lower channel, between the blue line and red line – or even lower.
Although there are a few price bars above the blue line, you can see that generally everything else falls below it.
To illustrate, let’s take a look at the specific period indicated within yellow brackets below:
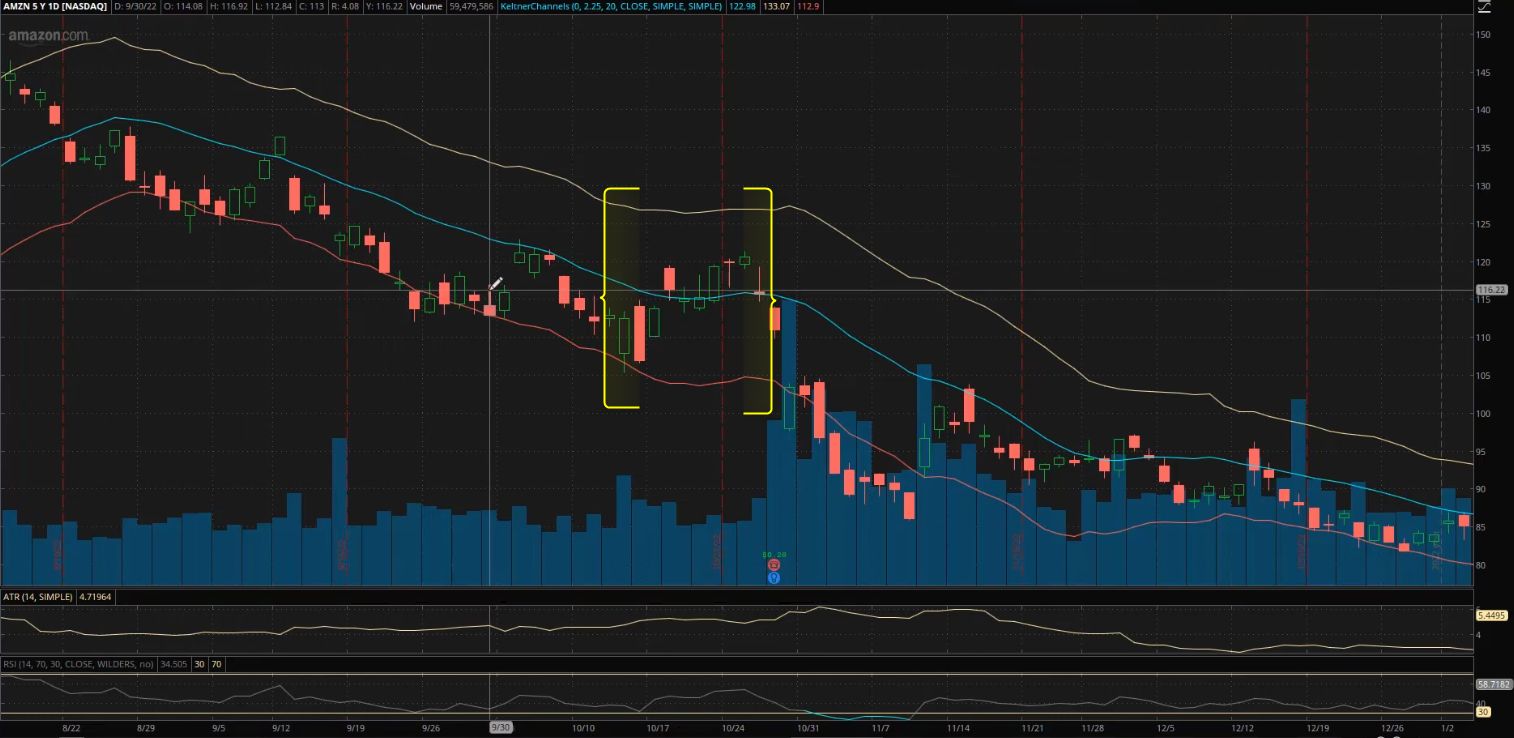
It would be perfectly reasonable to say, “The stock is not in a downtrend over this timeframe.” However, if you consider the chart as a whole – including the data outside of the highlighted period - it could still be said that this stock is in a downtrend because most of the price activity was in the lower Keltner channel.
As you can see, there is some discretion for how you frame or define a downtrend when looking at a stock chart, but a Keltner channel can help clear this up.
Another method for identifying a downtrend might be simpler. It uses a moving average line – which, conveniently, is the middle line of a Keltner channel.
For this method, ignore the red and tan lines in the previous examples; focus only on the blue one in the center. This is our simple moving average line. You can see that the price activity is generally below that blue line.
This is another simple way to identify a stock in a downtrend: most of the price activity is below the simple moving average line.
Video About Downtrends
Check out this video for an in-depth walkthrough that shows how to identify downtrends in a stock chart.
Why Does It Matter if a Stock is in a Downtrend or Not?
Some stockholders may think that if a stock’s price is in a particular trending direction, that trend might continue. In other words, if a stock is trending down, then some may consider avoiding or shorting that particular stock.
While that is a common thought, more data can give you a clearer picture of a stock’s performance over time.
Here at Stock Market Guides, we bring more data into the picture. We show you historical trends of stock performance, and what would have happened in the past if you invested in a downtrending stock. Would it have resulted in a loss? Are there cases where it could’ve been an opportunity to buy low and sell high?
We aim to shine light on historical data and answer those questions. That way, you do not have to rely on a common saying or ideology about how to invest your cash or even which stocks to avoid. Instead, we provide data that says where there is an investment opportunity with a track record of profitability (or not).
How Do You Find Downtrending Stocks?
You can find them by using our Downtrending Stocks scanner. It's a free tool we offer here at Stock Market Guides. It uses our proprietary scanning technology to find stocks that are in a downtrend.
Here's how the scanner results look:
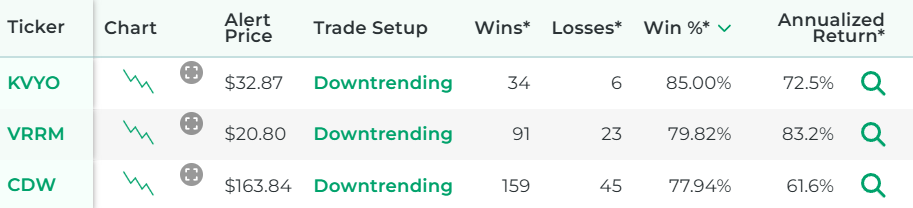
That tool ensures that you don't have to waste time flipping through stock charts manually to find downtrending stocks.
How Well Does Buying Downtrending Stocks Actually Work?
The idea of a downtrending stock trading strategy sounds nice to many people because it offers a clear, easy-to-understand way to find a trade setup. Buy low, sell high. If a good stock is in a downtrend, it might offer an opportunity to get it at a discounted price.
But does it actually work? Can traders indeed generate profits by trading stocks in a downtrend?
That's exactly what our company can help answer for you, since our scanner technology has allowed us to do our own research on that precise question.
The answer is that trades based on downtrending stocks are not always profitable, but many times they are. For certain stocks, they might have a particularly strong track record of success according to our backtest research.
Here is some data that shows how a proprietary downtrending stocks trading strategy we created has performed historically according to backtests:
Wins
---
Losses
---
Win Percentage
---
Annualized Return
---
Anyone who signs up for our swing trading scanner service will be able to see stocks that qualify for that trading strategy in real time.
Learning More About Downtrends
You can contact us any time if you would like to ask any questions about downtrends or anything else related to the stock market.
Join Our Free Email List
Get emails from us about ways to potentially make money in the stock market.
Stock Market Guides
You can trade without an edge, but why?
What We Offer
Stock Market Guides identifies stock and option trading opportunities that have a historical track record of profitability in backtests.
Average Annualized Return
43.1%