Heikin Ashi Strategy - Use Heikin Ashi Candles to Find Breakout Stocks
Stock Market Guides is not a financial advisor. Our content is strictly educational and should not be considered financial advice.
Heikin Ashi candlesticks are popular among stock market traders and are used for a variety of trading strategies.
If you are looking to learn a Heikin Ashi trading strategy or want to understand more about Heikin Ashi price candles in general, then you're in the right place.
This article will offer a complete Heikin Ashi trading strategy that can be used by active traders. First, let's go over how Heikin Ashi candles work.
What Exactly Are Heikin Ashi Candles?
Heikin ashi candles are a type of price candlestick found on a stock chart.
Stock charts show how a stock's price has changed over time, and that price activity can be conveyed in different ways. One of those ways is with price candlesticks, or price candles, which are also sometimes referred to as price bars.
Each price candle represents a pre-specified period of time, such as one day or one hour. Candles give information that might be pertinent to an investor, including the open price, close price, high price, and low price of the period.
Heikin Ashi price candles are different from the typical ones seen on most stock charts. They have the same shape and type of appearance, but they are calculated differently.
The term "Heikin Ashi" comes from the Japanese language, and it translates to "average bars." This is because each Heikin Ashi candle is calculated based on the average of prices during a given period.
They are similar to traditional candlestick charts, but they show price movement in a way that many traders find makes trends more apparent.
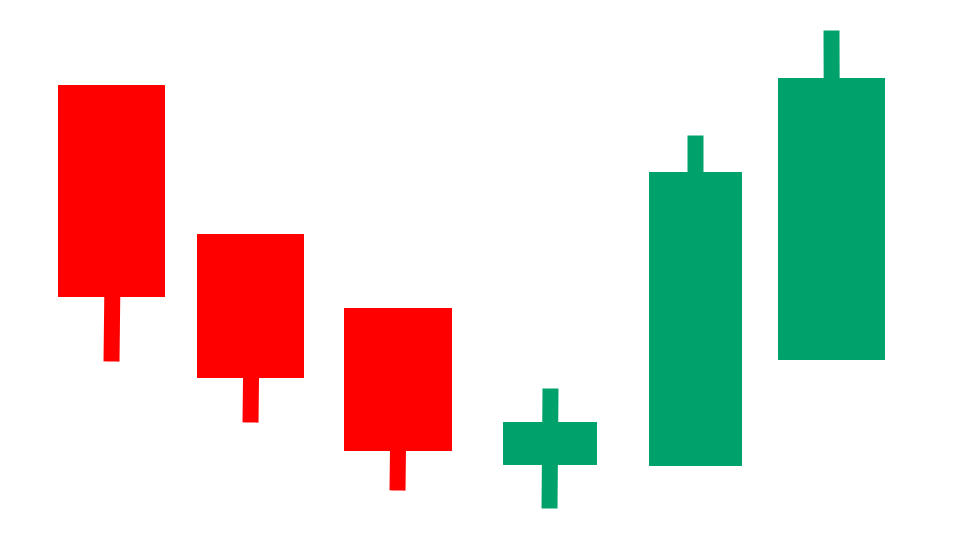
That image is a graphical icon that gives an idea visually of what a chart with heikin ashi candles might look like. The red and green bars have a tendency to cluster together, which makes it easier to spot trends.
Stock Market Guides
Stock Market Guides identifies swing trading opportunities that have a historical track record of profitability in backtests.
Average Annualized Return
79.4%
How Do Traders Use Heikin Ashi Candles?
Since heikin ashi candles might make it easier to spot a trend, they can offer relatively easy entry and exit signals for potential trades.
Here's an example of a stock chart where the setting has been enabled to display heikin ashi candles:
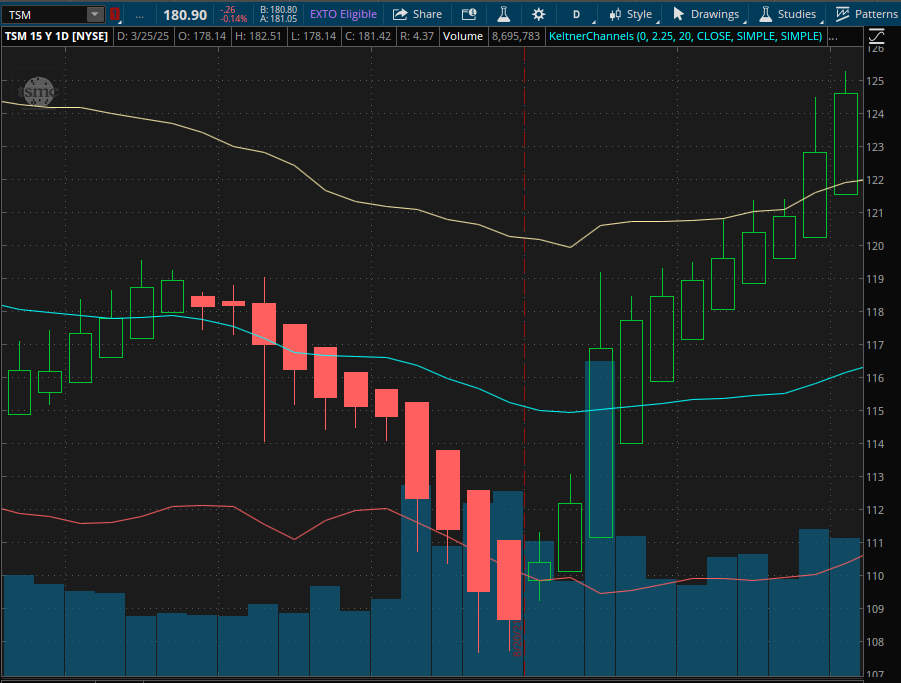
You can see how the red and green bars are bunched together, which makes price trends seem more apparent.
If the heikin ashi candlestick bars turn from red to green, that alone could be the basis of a heikin ashi trading strategy. That is referred to by some as a Heikin Ashi breakout strategy.
The idea is that the first green bar might lead to a cluster of green bars. Traders could buy the stock to try to capitalize.
As with any trading strategy, though, there are no guarantees. No strategy wins every time.
How Do You Find Stocks That Have Heikin Ashi Breakouts?
You can find them by using our Heikin Ashi Breakout scanner. It's a free tool we offer here at Stock Market Guides. It uses our proprietary scanning technology to find stocks that just had a heikin ashi breakout on a daily chart.
Here's how the scanner results look:
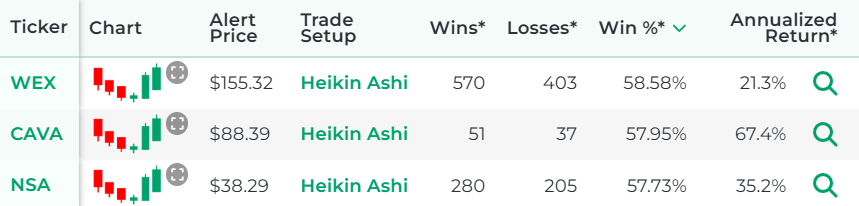
That tool ensures that you don't have to waste time flipping through stock charts manually to find stocks with a heikin ashi breakout.
Video About Heikin Ashi Strategy
Here's a video that explains a Heikin Ashi Strategy and gives examples:
Example of a Heikin Ashi Trading Strategy
For this example of a heikin ashi strategy, we're going to use a daily chart, where each price candle represents one day of price activity. That means it would be a swing trading strategy where the trade is designed to last more than one day but not for the long haul.
Entry for the Heikin Ashi Trading Strategy
The entry for this Heikin Ashi trading strategy will be as follows:
The entry criterion for our Heikin Ashi trading strategy is very simple.
Exit for the Heikin Ashi Trading Strategy
There are a lot of possibilities here for the exit. For a heikin ashi breakout strategy, some traders will simply exit the trade once there is a red heikin ashi candle.
Others want to have clearer boundaries for the trade. For those people, it can be helpful to define three different criteria for the exit: profit target, stop loss, and time limit.
Not everyone uses all three, and that's totally fine. Ultimately, you can set these values however you want. But for the purposes of this strategy example, we will define all three:
- Profit Target
We will set the profit target at 1.5 ATRs away from the entry price.
ATR is an indicator in the stock market that measures a stock's recent price volatility. Most trading platforms have it available as an indicator you can enable.
Our profit target criterion indicates that we will take the ATR value of the stock, multiply it by 1.5, and add it to the price we paid when we bought the stock. That will be our profit target, and we can set up a sell limit order at that price.
- Stop Loss
We will set the stop loss at 3 ATRs below the entry price. This means we take the ATR value of the stock, multiply it by 3, and subtract it from the price we paid to buy the stock.
That will be our stop loss, and we can set up a stop order at that price.
- Time Limit
We will set the time limit as one week since this is a swing trade. If the stock has not hit either the profit target or stop loss by the time limit, then we will close the trade manually at the opening bell seven calendar days after entry.
How Well Do Heikin Ashi Breakouts Actually Work?
The idea of a heikin ashi breakout strategy sounds nice to many people because it offers a clear, easy-to-understand way to find a trade setup.
But does it actually work? Can traders indeed generate profits by trading heikin ashi breakouts?
That's exactly what our company can help answer for you, since our scanner technology has allowed us to do our own research on that precise question.
The answer is that trades based on a heikin ashi strategy are not always profitable, but for certain stocks they might indeed have a track record of success according to our backtest research.
Here is some data that shows how a proprietary heikin ashi trading strategy we created has performed historically according to backtests:
Wins
---
Losses
---
Win Percentage
---
Annualized Return
---
Anyone who signs up for our swing trading scanner service will be able to see stocks that qualify for that trading strategy in real time.
Learning More About Heikin Ashi Strategies
You can contact us any time if you would like to ask any questions about heikin ashi candlesticks or anything else related to the stock market.
Join Our Free Email List
Get emails from us about ways to potentially make money in the stock market.
Stock Market Guides
You can trade without an edge, but why?
What We Offer
Stock Market Guides identifies swing trading opportunities that have a historical track record of profitability in backtests.
Average Annualized Return
79.4%