RSI Indicator in Stock Trading
Stock Market Guides is not a financial advisor. Our content is strictly educational and should not be considered financial advice.
The RSI indicator in stock trading is one that's commonly used by traders to identify potential investment opportunities.
If you aren't sure what the RSI indicator is and want to learn more about it, then you're in the right place. This guide will explain how it works and give examples of how traders use it.
What Does RSI Stand For?
RSI stands for Relative Strength Index.
Stock Market Guides
Stock Market Guides identifies swing trading opportunities that have a historical track record of profitability in backtests.
Average Annualized Return
79.4%
What Does the RSI Indicator Measure?
RSI is a type of oscillating indicator. It offers investors a way of determining whether a given stock might be oversold or overbought.
If a stock is oversold, it might present an opportunity to profit from buying the stock.
If a stock is overbought, it might present an opportunity to profit from shorting the stock.
It uses the stock's recent price history to determine the RSI value, and the values range between 0 and 100.
What Are the Default RSI Settings?
An RSI value of 30 or below indicates the stock is oversold. An RSI value of 70 or higher indicates the stock is overbought.
By default, the RSI is calculated based on the last 14 periods of price activity. Those periods can be days, hours, or any other increment of time.
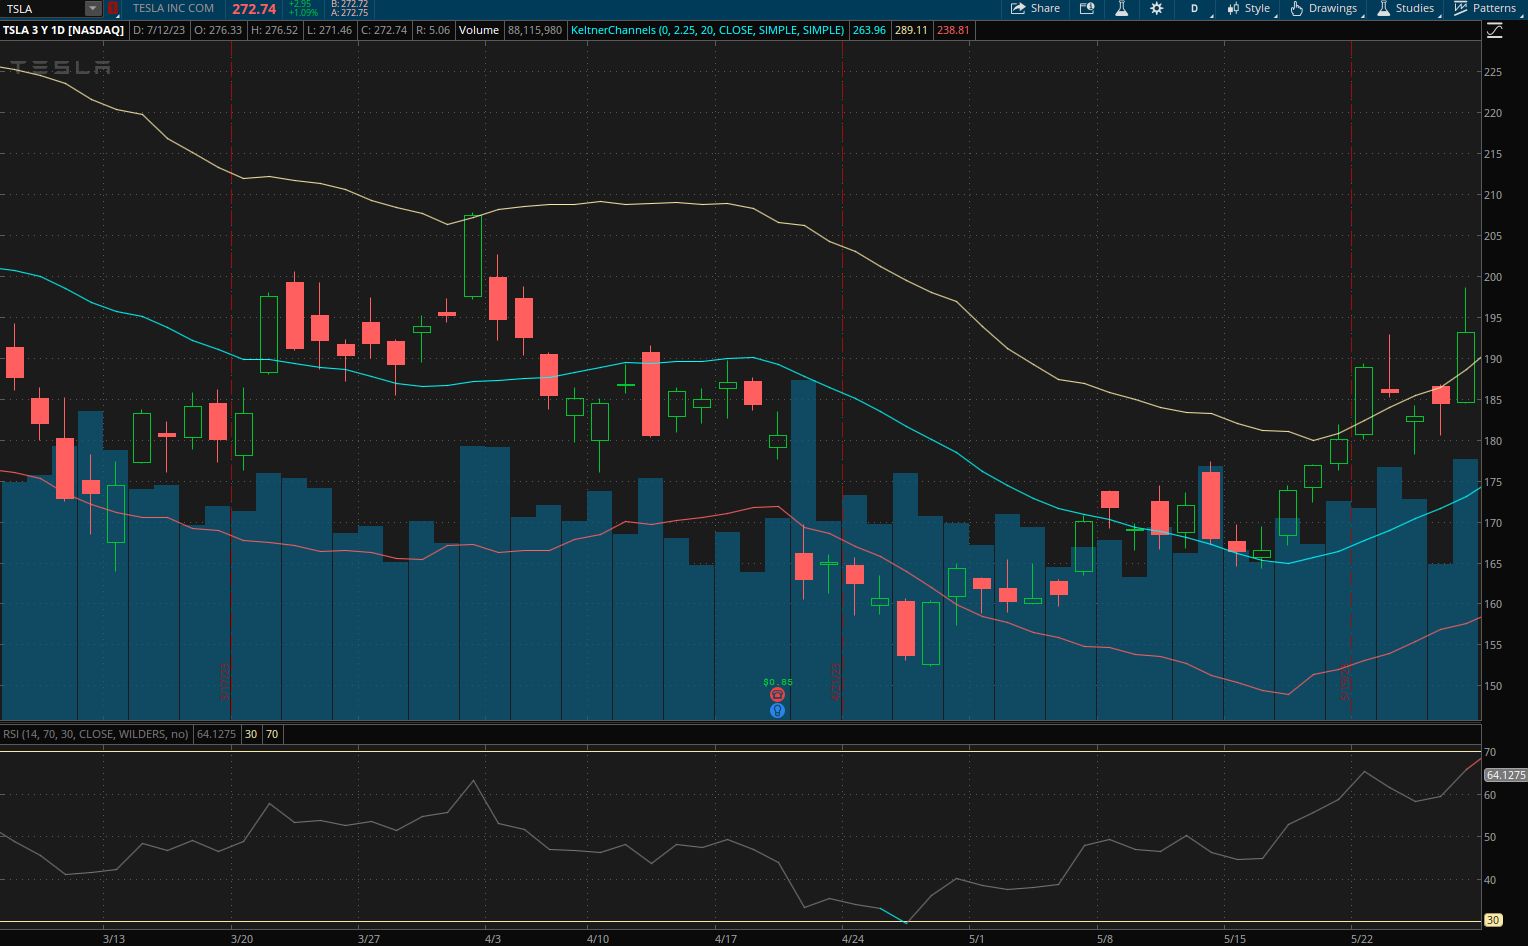
That image shows a stock chart for Tesla. It has an example of how the RSI indicator looks in the Thinkorswim desktop trading platform.
You can see it at the bottom of the image. It's depicted as a numeric value that varies as time goes on.
Notice that in the middle of the chart, the RSI value goes below 30. That is an indication that the stock might be overbought.
How is the RSI Indicator Value Calculated?
To calculate RSI, first you have to calculate Relative Strength (RS). It's calculated as follows:
Using the default settings for RSI, that means you look back at the last 14 periods. You look at each period that had a gain and take the average of those and that is the numerator. You then look at each period that had a loss and take the average of those and that is the denominator.
Once you have the Relative Strength value, then this is the calculation for RSI:
If you are just using the RSI indicator for the purpose of making trades, you will likely never need to calculate it on your own. Most trading platforms have RSI available as an indicator that can be enabled and auto-calculated for you.
Some investors choose to tweak the settings of RSI. You can change the number of periods that the RSI uses for its calculation. Or you can use different RSI values as your signal of stocks being overbought or oversold.
This video we made about the RSI indicator might be helpful:
How Do Traders Use the RSI Indicator?
It is possible to use an RSI trading strategy that is based on the indicator's value.
For example, since an RSI value of 30 or below indicates a stock might be oversold, a trader could consider it a buy signal.
And since an RSI value of 70 or higher indicates a stock might be overbought, a trade could consider it a sell signal.
RSI can be used as a standalone trade signal, or it could be used in conjunction with other indicators or chart patterns.
Our specialty here at Stock Market Guides is researching how trading strategies have performed historically. We've spent a lot of time researching the RSI indicator.
We did backtests and determined which RSI settings may have been most effective historically.
We also studied which stocks had the best results with using the RSI indicator.
We used that information to create our own RSI trading strategies, and you can learn the strategies and follow our RSI trade alerts by signing up for our service.
How Do You Find Stocks With a Low RSI Value?
You can find them by using our Oversold Stocks scanner. It's a free tool we offer here at Stock Market Guides. It uses our proprietary scanning technology to find stocks that have a low RSI value.
Here's how the scanner results look:
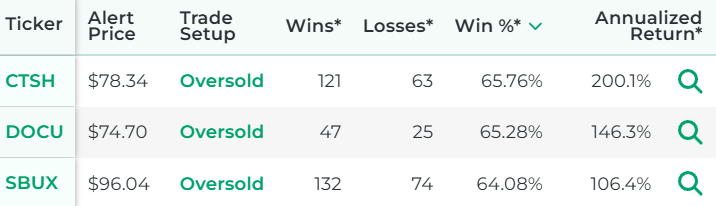
That tool ensures that you don't have to waste time flipping through stock charts manually to find oversold stocks.
Video About Oversold Stocks
Here's a video that explains oversold stocks and gives examples:
Our Research on RSI Trading Strategies
Our specialty here at Stock Market Guides is researching how trading strategies have performed historically. We've spent a lot of time researching the RSI indicator.
We did backtests and determined which RSI settings may have been most effective historically.
We also studied which stocks had the best results with using the RSI indicator.
Here is some data that shows how a proprietary RSI trading strategy we created has performed historically according to backtests:
Wins
---
Losses
---
Win Percentage
---
Annualized Return
---
Anyone who signs up for our swing trading scanner service will be able to see stocks that qualify for that trading strategy in real time.
How Do You See the RSI Indicator in Your Trading Platform?
It depends on the trading platform you use, but most of them do allow you to enable the RSI indicator.
To enable the RSI indicator in Thinkorswim, one popular trading platform, you right click the chart, select Studies from the drop down menu, then select Add Study, then click RSI.
For other trading platforms, the process might be different. But the concept might still be similar in that you're trying to find where you can toggle on and off their studies or indicators.
Learning More About RSI
You can contact us any time if you would like to ask any questions about RSI or about trading in general.
Join Our Free Email List
Get emails from us about ways to potentially make money in the stock market.
Stock Market Guides
You can trade without an edge, but why?
What We Offer
Stock Market Guides identifies swing trading opportunities that have a historical track record of profitability in backtests.
Average Annualized Return
79.4%