Oversold Stocks Today (Stocks with Low RSI)
Stock Market Guides is not a financial advisor. Our content is strictly educational and should not be considered financial advice.
These are stocks that have a low RSI value today according to our stock scanner. They're often referred to as oversold stocks. You can sort the RSI column in descending order to see the most oversold stocks.
As of June 11, 2026 at 1:14am Eastern Time
*Wins, Losses, Win Percentage, and Annualized Return are referring to how the stock performed in backtests for the Trade Setup indicated.
How to Use Our Scanner for Oversold Stocks
The above list represents stocks that are oversold today and have a low RSI value.
It's powered by our proprietary stock scanner, which searches once per day for stocks that are oversold.
You can sort columns using the up and down arrows next to the column name. You can add filters for the column values by clicking the "Add Filter" button above the list of oversold stocks. This scanner is designed for active stock traders.
This video shows how to use our scanner:
Scanner Features that Require a Subscription
Our free scanner for oversold stocks offers you the ability to find stocks that are oversold and have a low RSI, but you may need more than that to ensure you're making trades that have a true edge.
Our paid Swing Trading Service includes scanner features that are designed to offer you all the intelligence our research can offer. These are the scanner features you get if you pay for a subscription:
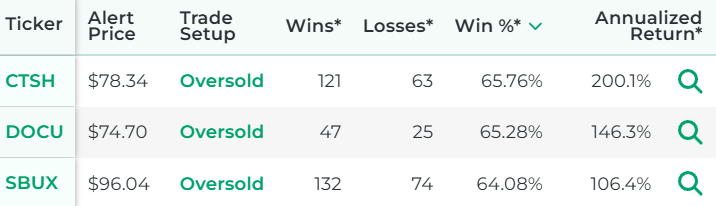
- See the historical backtested performance for each scan result. It looks like this:
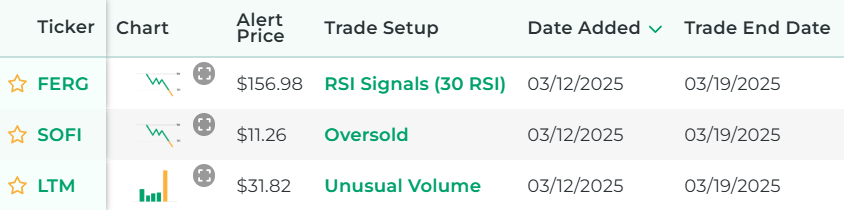
- See full trade setups for each scan result, including when to enter and exit. It looks like this:
- Get alerted when there are new scan results (by text or email).
- Get access to real-time scan updates throughout the trading day.
- Access scan results for all trading strategies in a single scan to easily see which trade setups have the best backtested performance across the entire market at any given time.
- Get access to scan results for our proprietary trading strategies, which required years of research to develop.
- Find Stock Trade Setups That Have a Backtested Edge
- Has DIY Swing Trading Scanner
- Get Swing Trade Picks from Our Scanner: 79.4% Average Annualized Return in Backtests
Here's a video that explains the difference between our free oversold scanner and the scanner from our paid service:
Stock Market Guides
Stock Market Guides identifies swing trading opportunities that have a historical track record of profitability in backtests.
Average Annualized Return
79.4%
What Exactly Are Oversold Stocks?
When someone talks about oversold stocks, they're typically talking about stocks that have a low RSI value.
RSI stands for Relative Strength Index. RSI is a type of oscillating indicator. The RSI value is calculated based on the stock's recent price history and the values range between 0 and 100.
Since the idea is to find a stock that might be due for a rebound in price, a low RSI value is considered a bullish signal.
Here's an example of how an RSI indicator looks in a trading platform:

You'll notice there are two tan lines in that image. The lower one is at an RSI value of 30.
Any time that RSI value goes below that lower tan line, it's a sign that the stock has a low RSI value, or in other words, that it's an oversold stock. You can see in that particular image that the RSI line turns blue when the stock becomes oversold.
Here's a video that explains RSI in more detail:
How We Find Oversold Stocks Each Day
Our one-of-a-kind scanning technology is at the heart of everything we do here. We have a way to program a trading strategy into our scanner, and then it uses real-time data feeds to find any stocks that meet the criteria of the trading strategy.
In the case of finding stocks that are oversold each day, our scanner looks for stocks that have a low RSI value.
Our Criteria for Defining Oversold Stocks
To find stocks that are oversold, our scanner simply looks for stocks that have an RSI value below 30 as of the end of the most recent trading day.
Our system calculates RSI by first calculating the Relative Strength (RS) of a stock. It's calculated as follows:
We look back at the last 14 days for the scan featured on that page. We look at each day that had a gain and take the average of those, and that is the numerator. We then look at each day that had a loss and take the average of those, and that is the denominator.
Once we have the Relative Strength value for a stock, then this is the calculation we use to calculate its RSI value:
Other Popular Scans at Stock Market Guides
Want to see scans we have for other popular indicators and chart patterns? Check them out here:


Have Questions About Oversold Stocks or Our Services?
If you have questions about stocks with low RSI values or questions about any services we offer, you can contact us any time and we'll be ready to help.
Join Our Free Email List
Get emails from us about ways to potentially make money in the stock market.
Stock Market Guides
You can trade without an edge, but why?
What We Offer
Stock Market Guides identifies swing trading opportunities that have a historical track record of profitability in backtests.
Average Annualized Return
79.4%