RSI Trading Strategy
Stock Market Guides is not a financial advisor. Our content is strictly educational and should not be considered financial advice.
The RSI indicator is popular among stock market investors and is commonly used for a variety of trading strategies.
If you are looking to learn an RSI trading strategy or want to understand more about the RSI indicator in general, then you're in the right place.
This article will offer a complete RSI trading strategy that can be used by active traders. First, let's go over what the RSI indicator measures.
What Does the RSI Indicator Measure?
RSI is a type of stock indicator referred to as an oscillating indicator. It offers investors a way of determining whether a given stock might be oversold or overbought.
If a stock is oversold, it might present an opportunity to profit from buying the stock.
If a stock is overbought, it might present an opportunity to profit from shorting the stock.
It uses the stock's recent price history to determine the RSI value, and the values range between 0 and 100.
Stock Market Guides
Stock Market Guides identifies swing trading opportunities that have a historical track record of profitability in backtests.
Average Annualized Return
79.4%
Example of an RSI Trading Strategy
An RSI value of 30 or below indicates the stock is oversold, according to the person who created the indicator. An RSI value of 70 or higher indicates the stock is overbought.
By default, the RSI is calculated based on the last 14 periods of price activity. Those periods can be days, hours, or any other increment of time.
For this particular RSI trading strategy, we're going to use a daily chart. That means it would be a swing trading strategy.
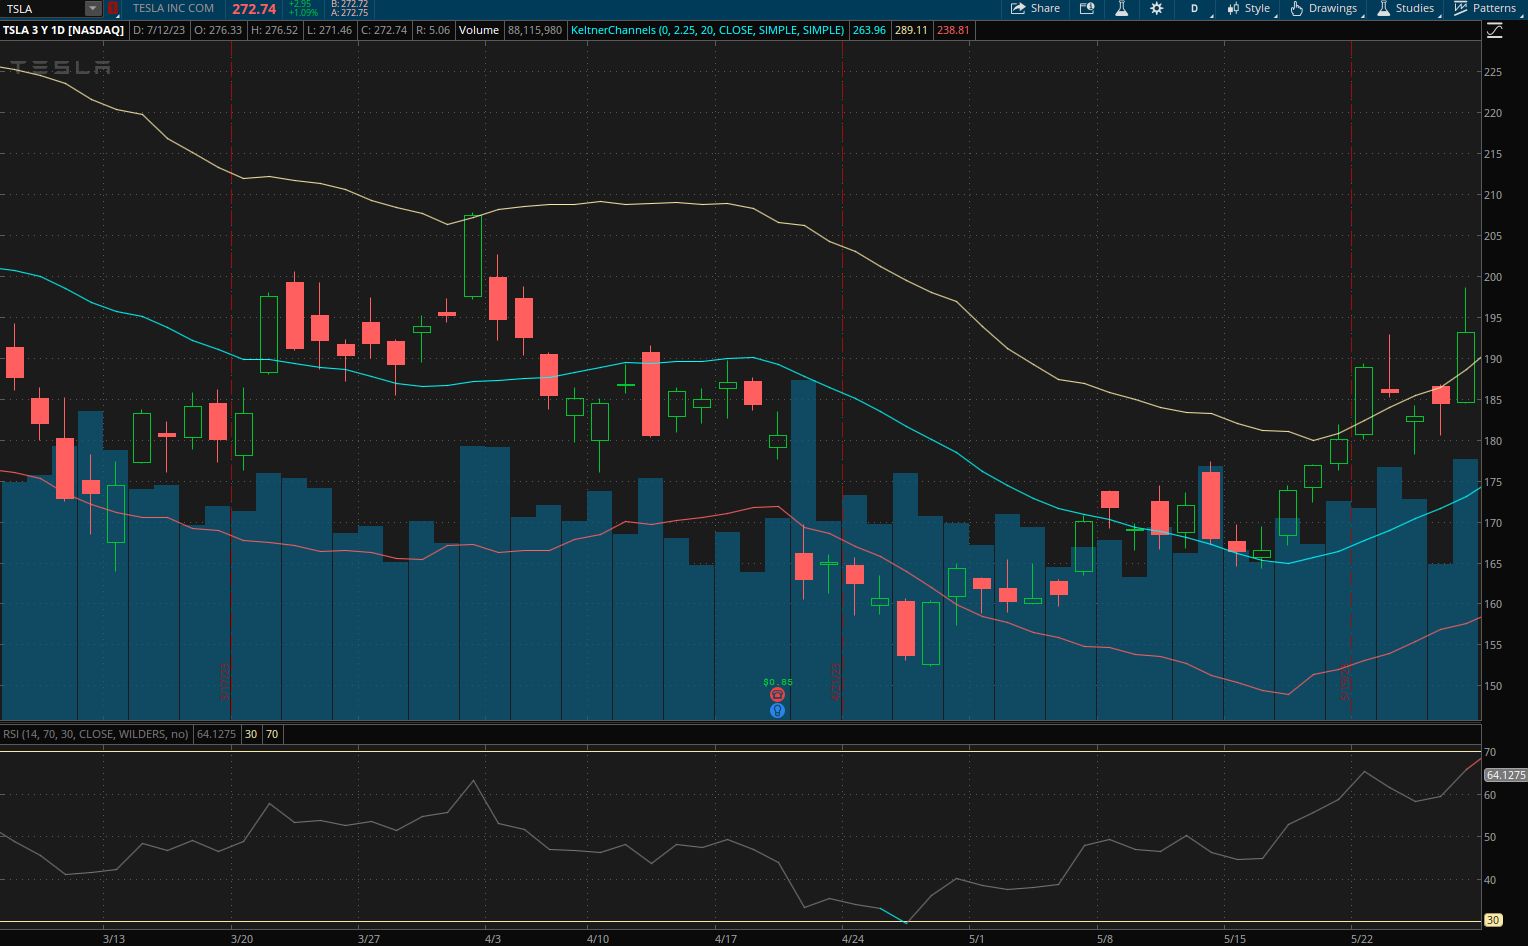
That image shows a stock chart for Tesla. It has an example of how the RSI indicator looks in the Thinkorswim desktop trading platform.
You can see it at the bottom of the image. It's depicted as a numeric value that varies as time goes on.
Notice that in the middle of the chart, the RSI value goes below 30. That is an indication that the stock might be overbought.
Entry for the RSI Trading Strategy
The entry for this RSI trading strategy will be as follows:
It's important to note that the current day's price activity needs to be finished. In other words, when we check for stocks that meet this criteria, it has to be after the stock market has closed for the day.
The entry criteria for our RSI trading strategy is very simple. You can see in the image above that right around the end of April, the RSI met this criteria.
If an investor had bought the stock using the trading strategy's entry criteria, you can see that he or she might have profited since the stock price generally moved up thereafter.
This video offers more information about the RSI trading strategy we're describing:
Exit for the RSI Trading Strategy
There are a lot of possibilities here for the exit.
We've found that the benefit of the RSI is primarily for determining an entry as opposed to an exit. So we'll use others means of defining our exit criteria.
For any given trading strategy, it can be helpful to define three different criteria for the exit: profit target, stop loss, and time limit.
Not everyone uses all three, and that's totally fine. Ultimately you can set these values however you want. But for the purposes of this strategy, we will define all three:
Profit Target
We will set the profit target at 2 ATRs away from the entry price.
ATR is an indicator in the stock market that measures a stock's recent price volatility. Most trading platforms have it available as an indicator you can enable.
Our profit target criteria indicates that we will take the ATR value for the stock, multiply it by two, and add it to the price we paid when we bought the stock. That will be our profit target and we can set up a sell limit order at that price.
Stop Loss
We will set the stop loss at 2 ATRs away from the entry price. This means we take the ATR value for the stock, multiply it by two, and subtract it from the price we paid when we bought the stock.
That will be our stop loss and we can set up a stop order at that price.
Time Limit
We will set the time limit as one week since this is a swing trade. If the stock has not hit either the profit target or stop loss by the time limit, then we will close the trade manually at the opening bell seven days after entry.
Performance of This RSI Trading Strategy
If we apply this RSI trading strategy to the Tesla example above, the results would be as follows:
The entry price shows as being $152.64.
Since the ATR value at the time of the trade entry was 7.39, it means the profit target would have been set at $167.42 and the stop loss would have been set at $137.86.
Over a one-week span after the entry, the price of Tesla did not reach either the profit target or stop loss. Therefore, according to our RSI trading strategy, we would have manually closed the position after holding it one week.
The chart shows the exit price as being $162.71 based on those conditions. That means this trade would have made a profit of $10.07 per share.
This RSI Trading Strategy Doesn't Always Win
The example above shows a case where this strategy might have generated a profit.
But that's just one example, and it's not enough to say with certainty that this RSI trading strategy would be profitable for you in the long run.
There are plenty of examples of this strategy losing as well, and ultimately the only way to be sure that any given trading strategy has a track record of success is to look at how it's performed in the past.
How Do You Find Stocks With a Low RSI Value?
You can find them by using our Oversold Stocks scanner. It's a free tool we offer here at Stock Market Guides. It uses our proprietary scanning technology to find stocks that have a low RSI value.
Here's how the scanner results look:
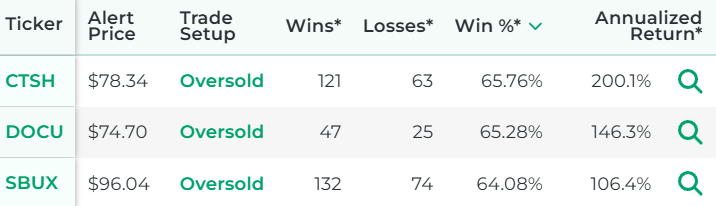
That tool ensures that you don't have to waste time flipping through stock charts manually to find oversold stocks.
Video About Oversold Stocks
Here's a video that explains oversold stocks and gives examples:
Our Research on RSI Trading Strategies
Our specialty here at Stock Market Guides is researching how trading strategies have performed historically. We've spent a lot of time researching the RSI indicator.
We did backtests and determined which RSI settings may have been most effective historically.
We also studied which stocks had the best results with using the RSI indicator.
Here is some data that shows how a proprietary RSI trading strategy we created has performed historically according to backtests:
Wins
---
Losses
---
Win Percentage
---
Annualized Return
---
Anyone who signs up for our swing trading scanner service will be able to see stocks that qualify for that trading strategy in real time.
Learning More About RSI
You can contact us any time if you would like to ask any questions about RSI or about trading in general.
Join Our Free Email List
Get emails from us about ways to potentially make money in the stock market.
Stock Market Guides
You can trade without an edge, but why?
What We Offer
Stock Market Guides identifies swing trading opportunities that have a historical track record of profitability in backtests.
Average Annualized Return
79.4%