Unusual Volume Stocks - Meaning and How Traders Use It
Stock Market Guides is not a financial advisor. Our content is strictly educational and should not be considered financial advice.
When it comes to the stock market, sometimes you might hear the term "unusual volume stocks" mentioned. It refers to a stock indicator that is popular among active stock traders.
This article will explain what an unusual volume stock is and how traders might be able to benefit from finding one.
What Exactly Is an Unusual Volume Stock?
An unusual volume stock is one that has seen a major surge in trading volume recently.
Volume is one of the key indicators in the world of stocks. Volume is defined as how many shares of a particular stock were sold and purchased during a particular period.
Volume therefore indicates the activity level that occurred for a stock during a particular time period. It can be measured in any time increment, such as one day, one minute, or any other increment.
A stock is said to have unusual volume if its most recent volume is particularly high relative to its average historical volume. Another way of putting it is that stocks with unusual volume have high relative volume.
Many trading platforms allow you to enable the volume indicator on stock charts. Volume is often depicted in bar chart format where the height of the bar corresponds with the amount of volume for that time period.

That image is a graphical icon that gives an idea visually of what an unusual volume stock looks like according to its volume indicator.
We highlighted the most recent bar in gold to signify that it has unusual volume. It has high relative volume compared to the other green volume bars next to it.
Stock Market Guides
Stock Market Guides identifies swing trading opportunities that have a historical track record of profitability in backtests.
Average Annualized Return
79.4%
What Does an Unusual Volume Stock Look Like On A Stock Chart?
The image below is an example of a stock chart where the stock is unusual volume.
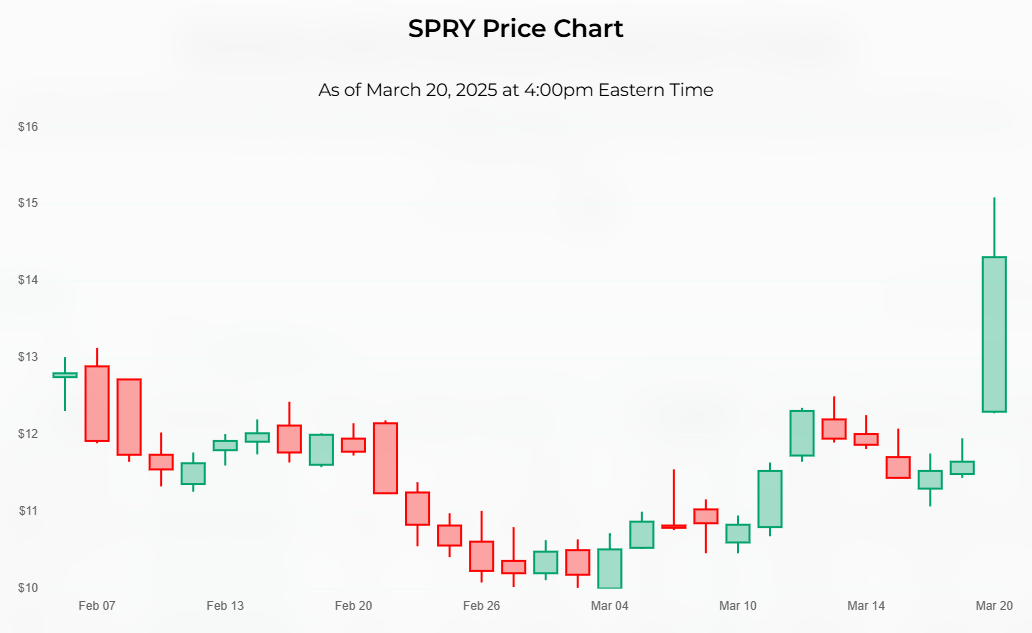
The price of a stock won't always make it obvious when there has been unusual volume. But sometimes, high relative volume can accompany price surges in either direction.
Notice the price bar at the far right of the stock chart in the image. It had a price surge that corresponded with a day when it had unusual volume.
How Do Traders Use Unusual Volume Stocks?
Stocks that have unusual volume have a lot of eyes on them, and that offers the potential for some big price movements.
When stocks have that sort of potential, they can draw the attention of active traders. Many active traders look for stocks that can exhibit a big change in price in a short period of time. Stocks with high relative volume are seen by some traders as being ripe for a potential price surge.
Is an Unusual Volume Stock Bullish or Bearish?
Unusual volume stocks are generally considered neither bullish nor bearish. Just because a stock has high relative volume doesn't mean that the price is likely to go one direction or the other.
The volume could exhibit a lot of buying pressure, selling pressure, or both. As a result, there may not be a telling sign of which way the price is headed next.
If there is a price surge associated with the unusual volume, some traders will trade in the direction of the price surge. For example, if the price surged upward, one might buy the stock in anticipation of the price momentum continuing. This is like a breakout trade.
Others might trade in the opposite direction and buy the stock if it had a large negative price surge associated with the unusual volume. This approach is like a mean reversion trading approach where the trader anticipates the stock will return to its normal price levels after getting overextended price-wise.
How Do You Find Unusual Volume Stocks?
You can find them by using our Unusual Volume Stocks scanner. It's a free tool we offer here at Stock Market Guides. It uses our proprietary scanning technology to find stocks that have unusual volume.
Here's how the scanner results look:
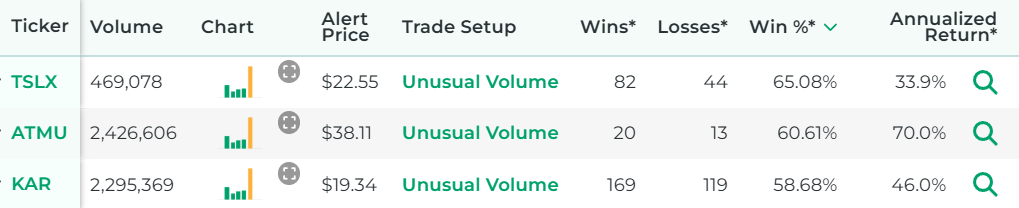
That tool ensures that you don't have to waste time flipping through stock charts manually to find stocks with high relative volume.
Example of an Unusual Volume Stock Trading Strategy
For this example of an unusual volume stock trading strategy, we're going to use a daily chart, where each price bar represents one day of price activity. That means it would be a swing trading strategy where the trade is designed to last more than one day but not for the long haul.
Entry for the Unusual Volume Stock Trading Strategy
The entry for this Unusual Volume Stock trading strategy will be as follows:
The entry criterion for our Unusual Volume Stock trading strategy is very simple.
Exit for the Unusual Volume Stock Trading Strategy
There are a lot of possibilities here for the exit.
For any given trading strategy, it can be helpful to define three different criteria for the exit: profit target, stop loss, and time limit.
Not everyone uses all three, and that's totally fine. Ultimately, you can set these values however you want. But for the purposes of this strategy example, we will define all three:
- Profit Target
We will set the profit target at 1.5 ATRs away from the entry price.
ATR is an indicator in the stock market that measures a stock's recent price volatility. Most trading platforms have it available as an indicator you can enable.
Our profit target criterion indicates that we will take the ATR value of the stock, multiply it by 1.5, and add it to the price we paid when we bought the stock. That will be our profit target and we can set up a sell limit order at that price.
- Stop Loss
We will set the stop loss at 2 ATRs below our entry price. This means we take the ATR value of the stock, multiply it by 2, and subtract it from our entry price.
That will be our stop loss and we can set up a stop order at that price.
- Time Limit
We will set the time limit as one week since this is a swing trade. If the stock has not hit either the profit target or stop loss by the time limit, then we will close the trade manually at the opening bell seven calendar days after entry.
How Well Does Buying Unusual Volume Stocks Actually Work?
The idea of an unusual volume stock trading strategy sounds nice to many people because it offers a clear, easy-to-understand way to find a trade setup.
But does it actually work? Can traders indeed generate profits by trading unusual volume stocks?
That's exactly what our company can help answer for you, since our scanner technology has allowed us to do our own research on that precise question.
The answer is that trades based on unusual volume stocks are not always profitable, but many times they are. For certain stocks, they might have a particularly strong track record of success according to our backtest research.
Here is some data that shows how a proprietary unusual volume stocks trading strategy we created has performed historically according to backtests:
Wins
---
Losses
---
Win Percentage
---
Annualized Return
---
Anyone who signs up for our swing trading scanner service will be able to see stocks that qualify for that trading strategy in real time.
Learning More About Unusual Volume Stocks
You can contact us any time if you would like to ask any questions about unusual volume stocks or anything else related to the stock market.
Join Our Free Email List
Get emails from us about ways to potentially make money in the stock market.
Stock Market Guides
You can trade without an edge, but why?
What We Offer
Stock Market Guides identifies swing trading opportunities that have a historical track record of profitability in backtests.
Average Annualized Return
79.4%