Stock Indicators
Learn stock indicators here and access our free scanner that shows which stocks exhibit these indicators right now. You'd have to upgrade to our paid service to see the historical backtested performance of the indicators for each stock.
Stock Indicator Quick Guide


To get alerts when stocks exhibit any of these stock indicators, you can sign up for our Swing Trading Service.
Oversold Stocks (Low RSI)
Meaning of the Indicator:
Finding Stocks With This Indicator:
You can see which stocks have this indicator today by using our Oversold Stocks scanner.
Stocks with Unusual Volume
Meaning of the Indicator:
If a stock has an unusual amount of volume, it means it has relatively high volume and that more people than normal have eyes on it.
Finding Stocks With This Indicator:
You can see which stocks have this indicator today by using our Unusual Volume scanner.
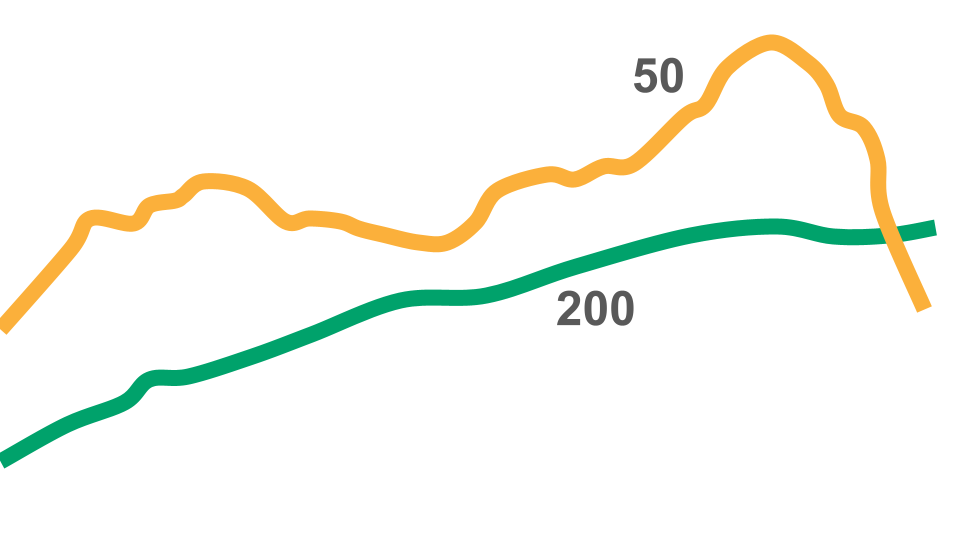
Golden Cross

Meaning of the Indicator:
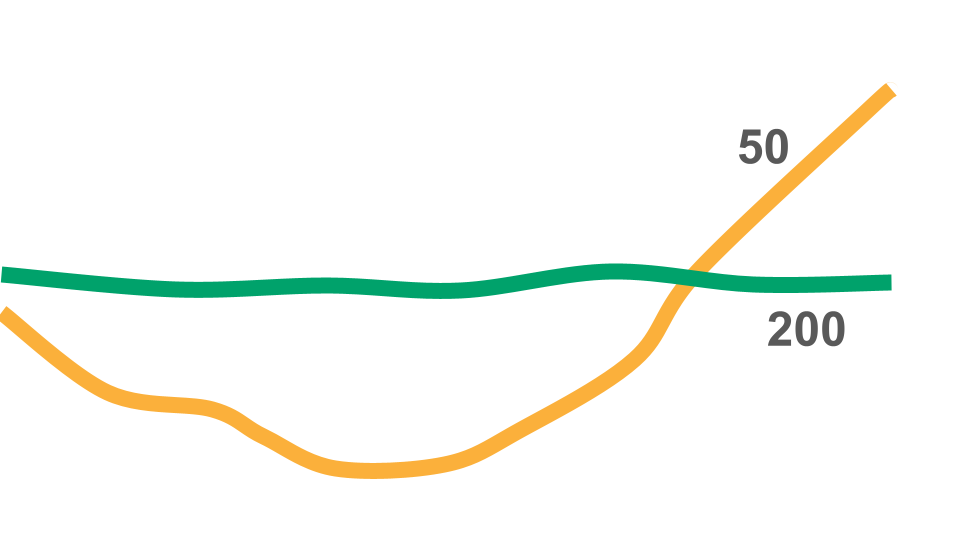
A Golden Cross occurs when a stock's 50-period moving average crosses over it's 200-period moving average.
Finding Stocks With This Indicator:
You can see which stocks have this indicator today by using our Golden Cross scanner.
Death Cross
Meaning of the Indicator:
A Death Cross occurs when a stock's 50-period moving average crosses under it's 200-period moving average.
Finding Stocks With This Indicator:
You can see which stocks have this indicator today by using our Death Cross scanner.
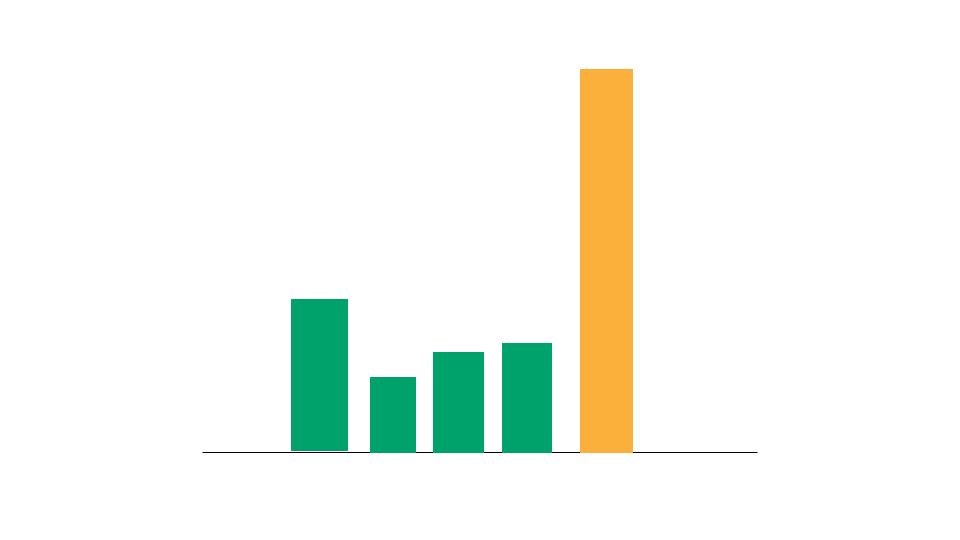
Momentum Stocks

Meaning of the Indicator:
Momentum stocks are ones that have exhibited major recent price increases.
Finding Stocks With This Indicator:
You can see which stocks have this indicator today by using our Momentum Stocks scanner.
Most Volatile Stocks

Meaning of the Indicator:
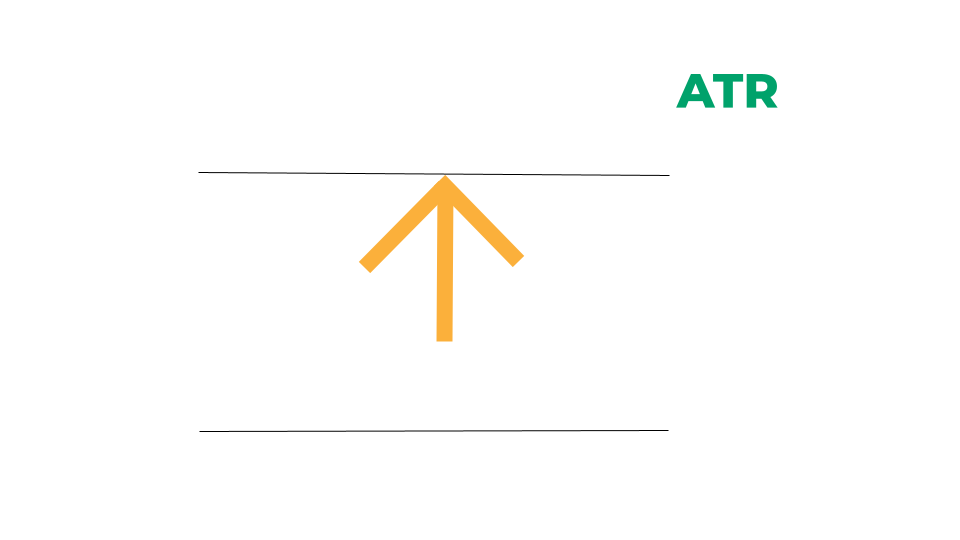
Volatile stocks are ones exhibiting major price swings. We measure volatile by looking at a stock's average true range as a percentage of its stock price.
Finding Stocks With This Indicator:
You can see which stocks have this indicator today by using our Most Volatile Stocks scanner.
Most Active Penny Stocks

Meaning of the Indicator:
Penny stocks are ones where the prices are just pennies per share. The more active they are with trading volume, the more liquid they are and the more potential they might have for major price swings.
Finding Stocks With This Indicator:
You can see which stocks have this indicator today by using our Most Active Penny Stocks scanner.
Keltner Channel Pullbacks

Meaning of the Indicator:
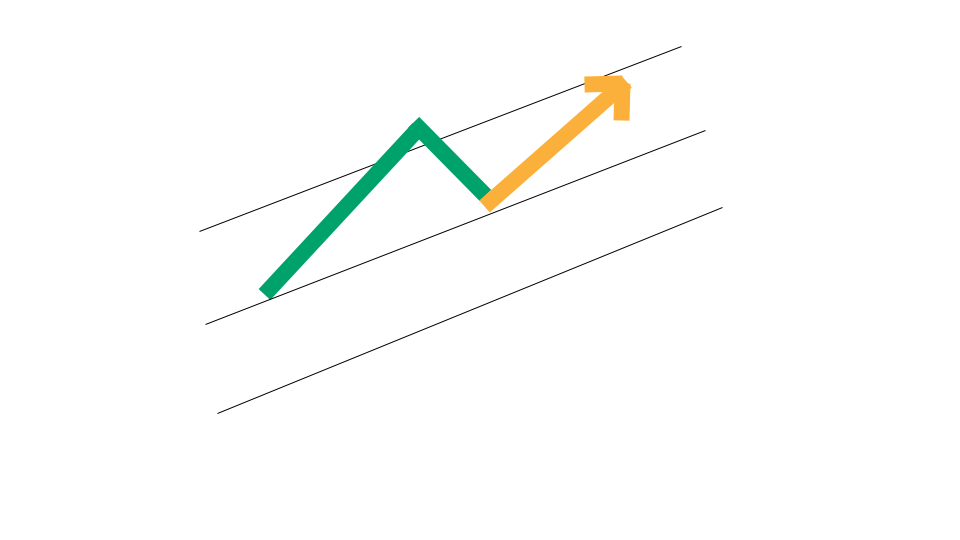
A Keltner Channel is helpful for identifying stocks that are trending. Stocks that are in a pullback within a Keltner Channel might offer an opportunity to buy low on a stock that is trending upward.
Finding Stocks With This Indicator:
You can see which stocks have this indicator today by using our Keltner Channel Pullback scanner.
Mean Reversion Stocks
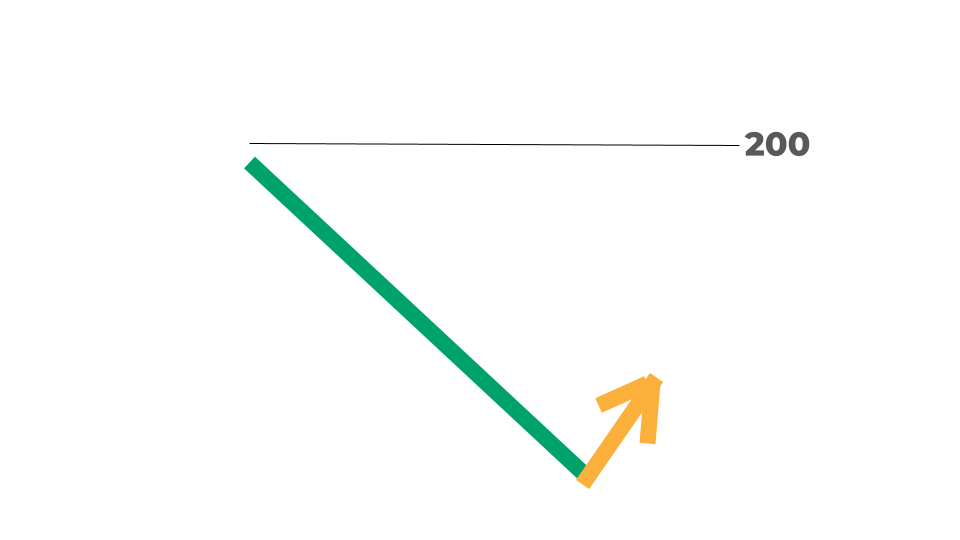
Meaning of the Indicator:
If a stock's price extends far beyond its historical average, or mean, then it might be due for mean reversion. In other words, the stock price might gravitate back to its historical average.
Finding Stocks With This Indicator:
You can see which stocks have this indicator today by using our Mean Reversion Stocks scanner.
Moving Average Crossovers
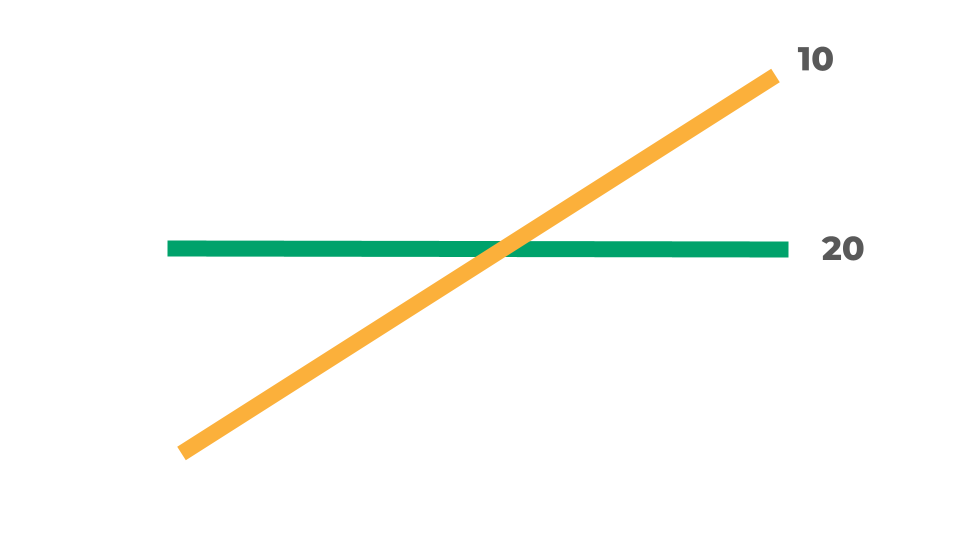
Meaning of the Indicator:
A moving average for a stock is typically denoted by a period of time, and it looks at the average price of that stock over that period. A moving average crossover occurs when moving averages with different periods cross.
Finding Stocks With This Indicator:
You can see which stocks have this indicator today by using our Moving Average Crossover scanner.
To get alerts when stocks exhibit any of these stock indicators, and to see how they performed historically in backtests for each stock, you can sign up for our Swing Trading Service.
Stock Indicator Scanner
Our Swing Trading Service includes access to our proprietary scanner technology. Our stock indicator scanner identifies trade opportunities that have a backtested edge. Here at Stock Market Guides, our specialty is bringing data and statistics to your trading decisions. With every stock trade setup that comes up in our stock indicator scanner, you’ll be able to see exactly how that trade setup has performed historically in backtests. This allows traders to make fully informed trading decisions. There’s no longer a need to take a blind leap of faith when making a stock trade.
How Our Stock Indicator Scanner Works
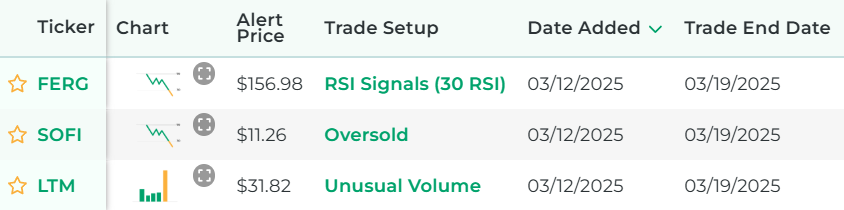
Here’s an example of what the results look like from our stock indicator scanner. You can see that each scan reflects a specific swing trading strategy based on a stock indicator. Each scan result shows not only the stock, but also how the stock performed historically for that trading strategy according to our backtest research.

Features of Our Stock Indicator Scanner
Shows Historical Performance
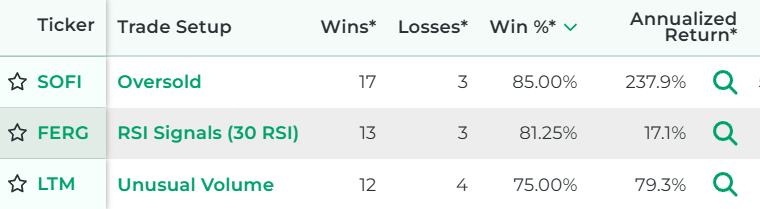
What makes our stock scanner one-of-a-kind is that each scan result shows how that stock performed in backtests when the stock indicator criteria was met in the past. Why waste time or money considering stock indicators that don’t have a track record of success?

Gives Complete Trade Setups
Each scan result offers a full trade setup based on the stock indicator our scanner identified. It gives you a specific amount of time to hold the position. This takes the guesswork out of your trading decisions. You know exactly how long to hold the position.
Get Alerts for New Scan Results
If you pay for our service, then you can enable alerts for any stock indicator scans you want. This means you will get alerted each time our scanner finds new stock indicators that have a backtested edge. Alerts can be sent by email or text. You can set your preference after you sign up for the service.

- Find Stock Trade Setups That Have a Backtested Edge
- Has DIY Swing Trading Scanner
- Get Swing Trade Picks from Our Scanner: 79.4% Average Annualized Return in Backtests
FAQs about Stock Indicators
Here are frequently-asked questions about stock indicators and why they might be important to investors.
What exactly is a stock indicator?
Stock indicators are typically mathematical calculations based on a stock’s price history or volume.
What is an example of a stock indicator?
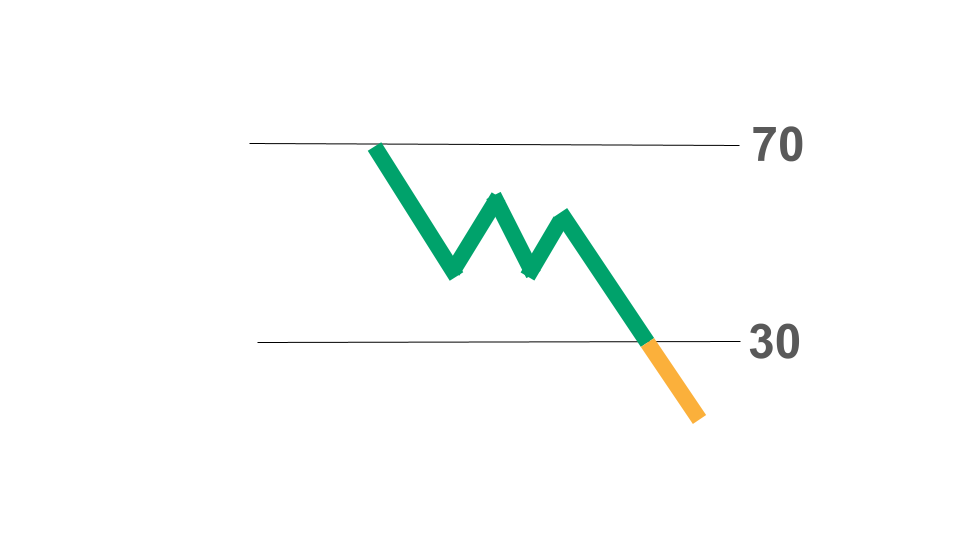
There are many types of stock indicators, including simple moving averages and exponential moving averages. This image is an example of the RSI indicator, which calculates the momentum of a stock’s price movements.

Why do stock indicators matter?
Stock indicators help give meaning to the price and volume activity that occurs with stocks. In other words, they put a stock's recent activity into perspective, oftentimes with a single metric. This information can be used to potentially profit from buying or selling the stock. Stock indicators are especially popular among active traders, such as swing traders.
How can you use stock indicators to make trading decisions?
What's nice about stock indicators is that many typically have their own rules for what constitutes the criteria being met, and therefore what would trigger a "buy" signal. So in other words, the indicator itself dictates the trade parameters. As a result, stock indicators typically make it relatively easy to determine when it's time for a trading decision. The challenging part is that not all stock indicators are created equal. Some perform better than others, and some stocks in particular have a good track record with particular indicators. That's the piece of the equation that we put at your fingertips with our paid service. We show you the backtested performance of each stock indicator.
Which are the best stock indicators?
Perhaps the best stock indicators are the ones that have the strongest track record of success. If you sign up for our service, you'll see the historical backtested performance of each stock indicator in real time as it occurs. This might help you decide which indicators are worth taking action on.
As Seen On


Customer Testimonials
The service you provide appears to be exactly as advertised. Without exaggeration, thus far your service has cut my research time by at least 35% - 40%. Regards from a happy user.
Dennis from Florida
I'm making money, that's what matters. Well worth the $70 per month. I hope to, and plan to, use your service for as long as you'll have me.
James from Alabama
Your quick responses are uncommon as I have been researching several services. The fact that you respond says a lot about your concerns for your clients.
Tom from Arizona
I have liked the service so far. I secured a couple nice wins this week.
Tim from Wisconsin
Join Our Free Email List
Get emails from us about ways to potentially make money in the stock market.