Wedge Chart Pattern - How It Works and How Traders Can Use It
Stock Market Guides is not a financial advisor. Our content is strictly educational and should not be considered financial advice.
When it comes to the stock market, sometimes you might hear the term "wedge" mentioned. It refers to a stock chart pattern that is popular among active stock traders.
This article will explain what a wedge chart pattern is and how traders might be able to benefit from using it.
What Exactly Is a Wedge?
A wedge is a stock chart pattern characterized by two trendlines that converge to form the shape of a wedge. One is a downward sloping line of resistance along the top that connects the price peaks. The other is an upward sloping line of support along the bottom that connects the price troughs.
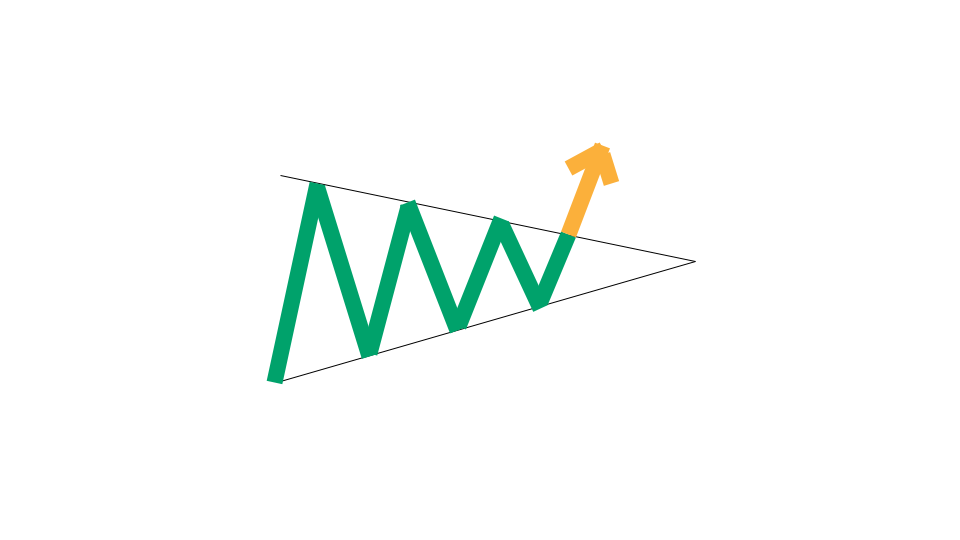
That image is a graphical icon that gives an idea visually of what a wedge chart pattern looks like.
Stock Market Guides
Stock Market Guides identifies swing trading opportunities that have a historical track record of profitability in backtests.
Average Annualized Return
79.4%
What Does a Wedge Look Like On A Stock Chart?
The image below is an example of a wedge pattern as shown on one of our stock charts.
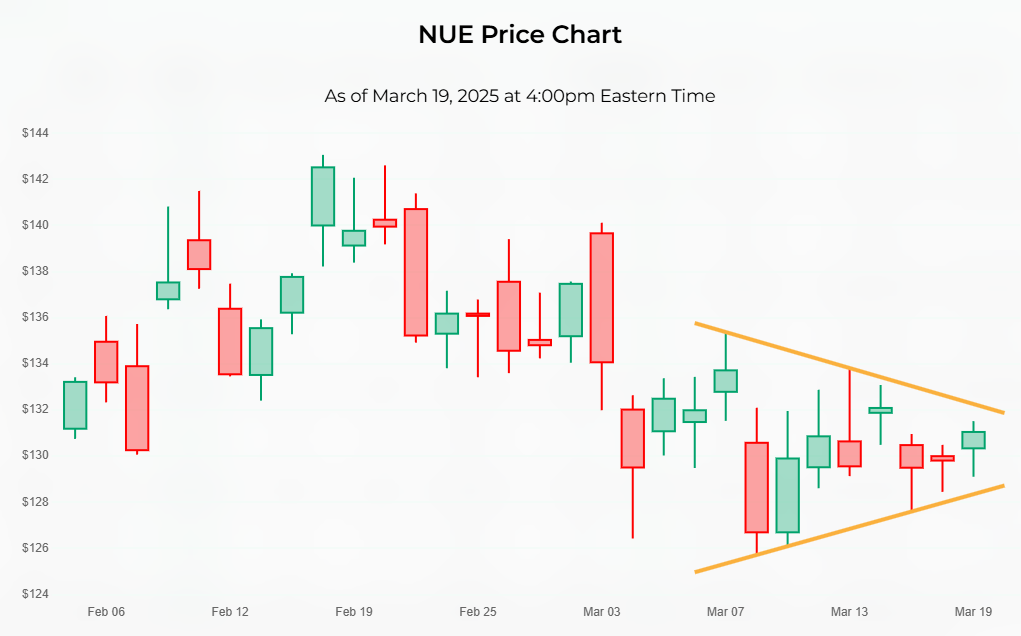
There are golden lines on our charts that automatically outline chart patterns when they're detected.
You can see the downward sloping top line where the resistance level is and the upward sloping bottom support level. The formation of those trend lines looks like a wedge, or like a sideways triangle pattern.
How Do Traders Use a Wedge?
The appearance of the wedge pattern indicates that the stock is experiencing a consolidation period. The price is making a series of higher lows (indicating buying pressure) and lower highs (indicating selling pressure). The price range between the highs and lows is therefore getting tighter and tighter.
Traders are typically waiting to see the price surge out of the wedge in one direction or another. When the period of price consolidation ends and the price makes a strong move, traders might follow the direction of the move and make trades that profit if the price continues in that direction.
Traders might wait to see which way the price breaks out of the wedge to determine how to trade it. If the price breaks through the upper resistance line of the wedge, that could be seen as a breakout and therefore an opportunity to buy the stock.
Is a Wedge Bullish or Bearish?
Standard symmetrical wedge chart patterns are generally considered neither bullish nor bearish while the wedge is forming. The price is consolidating, and until the price breaks out of that consolidation, there is no telling sign of which way the price might be headed.
Once the price breaks out of the wedge, that indicates whether it's bullish or bearish.
If the price breaks through the upper resistance line of the wedge, that could be seen as a breakout and therefore is bullish. This means that the stock's price might continue to go up afterward. A trader could capitalize by going long (meaning that they would be buying instead of shorting).
If the price breaks through the lower support line of the wedge, that could be seen as a breakdown and therefore is bearish. This means that the stock's price might continue to go down afterward. A trader could capitalize by going short.
Are There Other Types of Wedge Chart Patterns?
Aside from the symmetrical wedge trading pattern that has been described in this article thus far, there are also falling wedge patterns and rising wedge patterns.
A falling wedge pattern is one where the wedge tilts downward instead of being symmetrical. It's typically seen as a bullish pattern.
A rising wedge pattern is one where the wedge tilts upward instead of being symmetrical. It's typically seen as a bearish pattern.
How Do You Find Stocks That Have Wedge Patterns?
You can find them by using our Wedge scanner. It's a free tool we offer here at Stock Market Guides. It uses our proprietary scanning technology to find stocks that are in a wedge chart pattern.
Here's how the scanner results look:
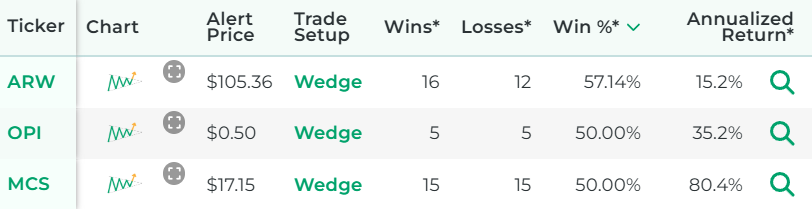
That tool ensures that you don't have to waste time flipping through stock charts manually to find stocks with a wedge pattern.
We also have a scanner that finds stocks with a falling wedge chart pattern.
Example of a Wedge Trading Strategy
For this example of a wedge trading strategy, we're going to use a daily chart, where each price bar represents one day of price activity. That means it would be a swing trading strategy where the trade is designed to last more than one day but not for the long haul.
Entry for the Wedge Trading Strategy
The entry for this Wedge trading strategy will be as follows:
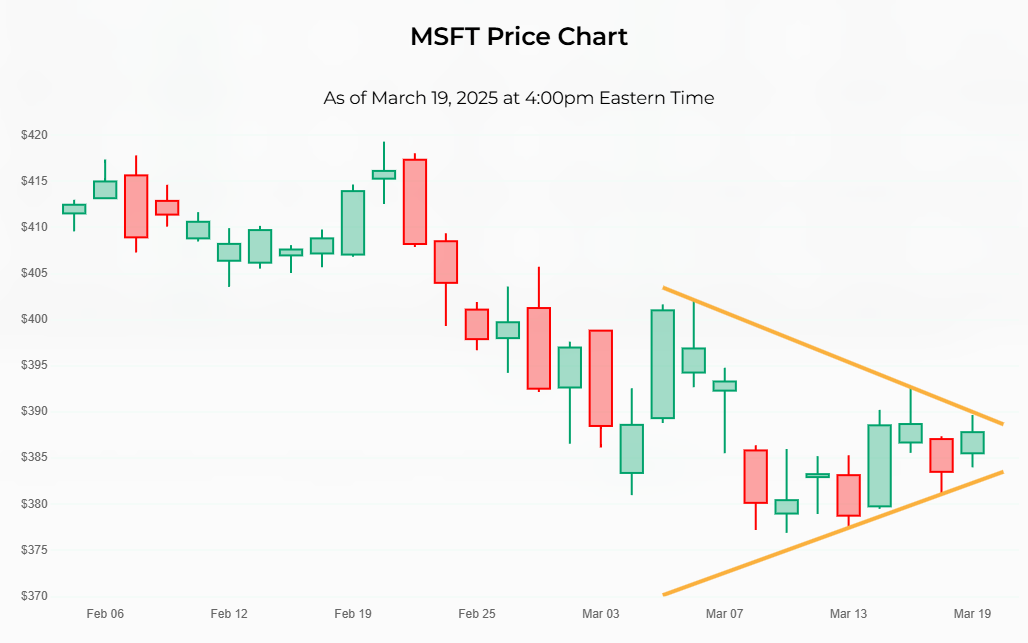
The entry criterion for our Wedge trading strategy is very simple. You can see in the stock chart below for Microsoft that the entry price would be right around $388, where that upper golden line is.
Exit for the Wedge Trading Strategy
There are a lot of possibilities here for the exit.
One benefit of using a stock chart pattern as a basis for making trades is that the pattern itself can help you determine exits in some cases.
For any given trading strategy, it can be helpful to define three different criteria for the exit: profit target, stop loss, and time limit.
Not everyone uses all three, and that's totally fine. Ultimately, you can set these values however you want. But for the purposes of this strategy example, we will define all three:
- Profit Target
We will set the profit target at 2 ATRs away from the entry price.
ATR is an indicator in the stock market that measures a stock's recent price volatility. Most trading platforms have it available as an indicator you can enable.
Our profit target criterion indicates that we will take the ATR value of the stock, multiply it by two, and add it to the price we paid when we bought the stock. That will be our profit target and we can set up a sell limit order at that price.
- Stop Loss
We will set the stop loss at 0.5 ATRs below the support line (the bottom trendline of the wedge). This means we take the ATR value of the stock, multiply it by 0.5, and subtract it from the price of the lower trendline from that day.
That will be our stop loss and we can set up a stop order at that price.
- Time Limit
We will set the time limit as one week since this is a swing trade. If the stock has not hit either the profit target or stop loss by the time limit, then we will close the trade manually at the opening bell seven calendar days after entry.
How Well Do Wedges Actually Work?
The idea of a wedge trading strategy sounds nice to many people because it offers a clear, easy-to-understand way to find and manage a trade setup.
But does it actually work? Can traders indeed generate profits by trading wedge chart patterns?
That's exactly what our company can help answer for you, since our scanner technology has allowed us to do our own research on that precise question.
The answer is that trades based on a wedge are not always profitable, but for certain stocks they might indeed have a track record of success according to our backtest research.
Here is some data that shows how a proprietary wedge trading strategy we created has performed historically according to backtests:
Wins
---
Losses
---
Win Percentage
---
Annualized Return
---
Anyone who signs up for our swing trading scanner service will be able to see stocks that qualify for that trading strategy in real time.
Learning More About Wedges
You can contact us any time if you would like to ask any questions about wedges or anything else related to the stock market.
Join Our Free Email List
Get emails from us about ways to potentially make money in the stock market.
Stock Market Guides
You can trade without an edge, but why?
What We Offer
Stock Market Guides identifies swing trading opportunities that have a historical track record of profitability in backtests.
Average Annualized Return
79.4%