How the ATR Indicator Works in Stock Trading
Stock Market Guides is not a financial advisor. Our content is strictly educational and should not be considered financial advice.
The ATR indicator in stock trading is one that's commonly used.
If you aren't sure what the ATR indicator is and want to learn more about it, then you're in the right place. This guide will explain how it works and give examples of how traders use it.
What Does ATR Stand For?
ATR stands for Average True Range.
Stock Market Guides
Stock Market Guides identifies stock trading opportunities that have a historical track record of profitability in backtests.
Average Annualized Return
43.1%
What Does the ATR Indicator Measure?
ATR is a stock indicator offers investors a way of measuring the recent price volatility for a stock.
It calculates the average amount that the price of a stock moved in a period over a given length of time.
So for example, if you are looking at a stock chart, and each price bar represents one day of price activity, then the ATR would tell you the average amount that the price of the stock moved in a day.
How is the ATR Indicator Value Calculated?
To calculate ATR, or average true range, first you have to understand how to calculate true range itself.
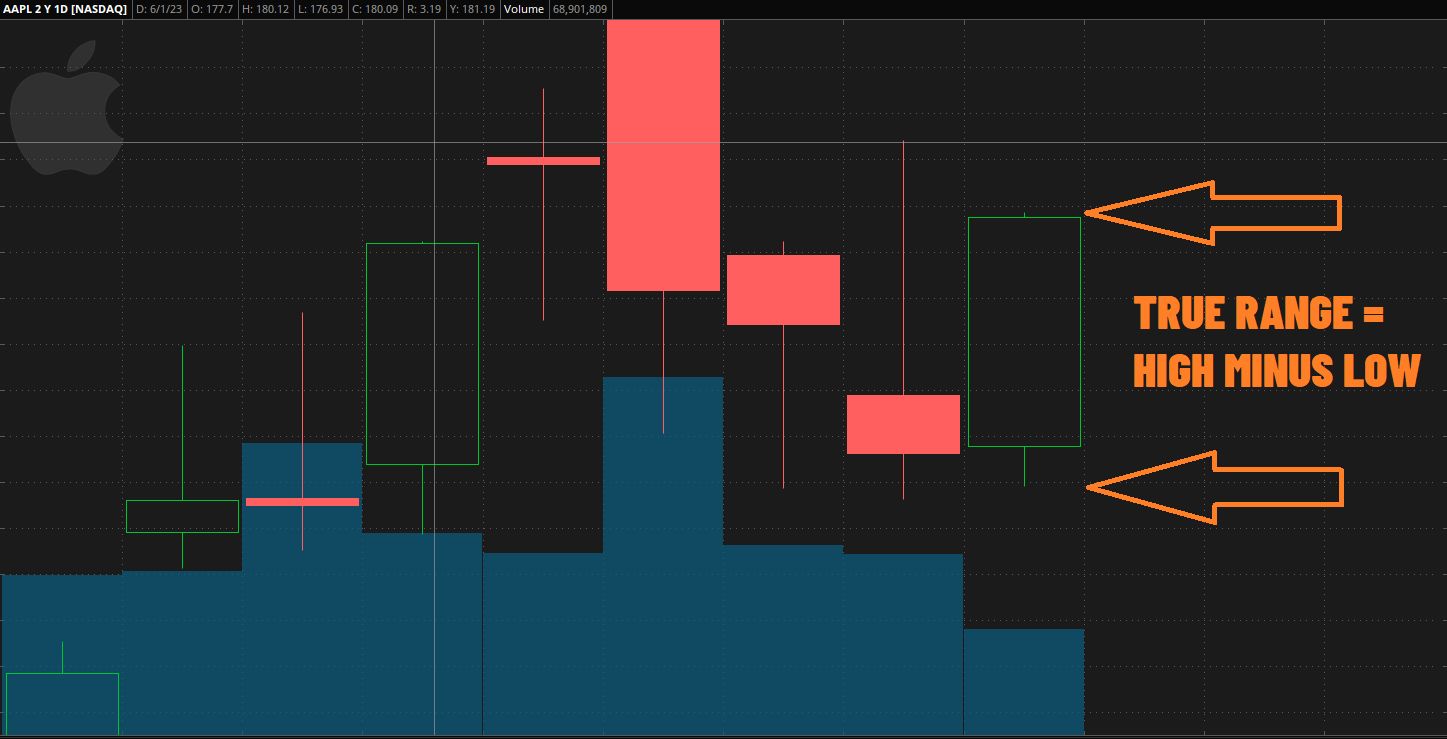
The image above shows a chart for Apple stock and depicts how true range is calculated. It's simply the high price minus the low price of any given price bar. In that image, the arrows are pointing to high and low of the green price bar on the far right side.
So imagine that on a given day, Apple stock had a high price of 110.00 and a low price of 100.00. The true range for Apple stock on that day would be 10.00.
To calculate the average true range, or ATR, over a number of periods, you add up the ATR of each period and then divide by the number of periods. By default, the ATR is typically calculated based on 14 periods.
You can modify the default settings for ATR. You can set the period count to a different number than 14.
You can also change the type of average that is used. The formula above is for a simple average, but there are other types of averages used by some for ATR calculations, including exponential and Wilders.
Video About the ATR Indicator
This video we made about the ATR indicator might be helpful:
How Do Traders Use the ATR Indicator?
The ATR indicator tells us information about the volatility of the stock's price in the recent past.
It's measuring how far the price is moving each period on average, which is a measure of price volatility. Traders and investors might benefit from knowing just how volatile a stock is. ATR is popular with some swing traders and day traders.
Another thing that some traders do is measure their profit targets or stop losses in terms of ATR. A reason for this is that it's kind of like having an apples-to-apples way to measure a given stock's price move regardless of which stock it is.
For example, imagine that you are trying to come up with a trading plan for yourself and trying to figure out where are you going to set stop losses when you make stock trades.
Now imagine that you determine you'll set the stop loss at $20 away from your entry price.
Well that can mean very different things for different stocks. If the stock is Tesla, it might move $20 in a single day. For other stocks, it might take a year for it to move $20.
So rather than use arbitrary numbers that mean different things for different stocks, you can measure your stop loss in terms of ATR. That gives you a way to measure the price movement in a consistent way across different stocks.
Imagine you're going to set your stop loss at 1 ATR away from your entry point. That means it's going to be equal to one day's worth of average price movement. It doesn't matter what the stock is, since it's just going to look at its recent price activity and set the stop loss based on a measure of that.
Setting the stop loss that way is not arbitrary. Instead it's meaningful and that's an example of one of the benefits of using ATR.
That example was for setting a stop loss using the ATR indicator, but you can use ATR for any purpose that involves measuring the movement of a stock price. It can be used to set profit targets, to measure how far away your entry point would be for a trade, or to specify the rules of a trading strategy you're working on.
The ATR indicator is also used in a variety of different stock market studies and other indicators. For example, Keltner Channels are calculated using ATR values.
How Do You Find Stocks With High ATR Values?
You can find them by using our Volatile Stocks scanner. It's a free tool we offer here at Stock Market Guides. It uses our proprietary scanning technology to find stocks that have high ATR values relative to their normal ATR values.
Here's how the scanner results look:
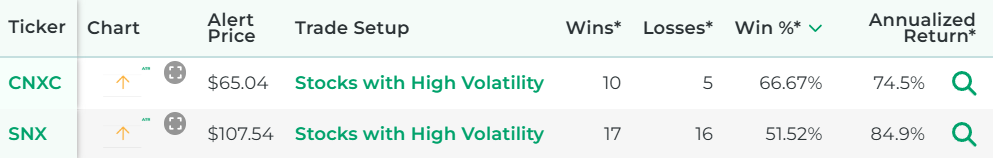
That tool ensures that you don't have to waste time flipping through stock charts manually to find stocks with high volatility.
How Well Does Buying Volatile Stocks Actually Work?
The idea of a trading strategy involving volatile stocks with high ATR values sounds nice to many people because it offers a clear, easy-to-understand way to find a trade setup.
But does it actually work? Can traders indeed generate profits by trading volatile stocks?
That's exactly what our company can help answer for you, since our scanner technology has allowed us to do our own research on that precise question.
The answer is that trades based on volatile stocks are not always profitable, but many times they are. For certain stocks, they might have a particularly strong track record of success according to our backtest research.
Here is some data that shows how a proprietary ATR trading strategy we created has performed historically according to backtests:
Wins
---
Losses
---
Win Percentage
---
Annualized Return
---
Anyone who signs up for our swing trading scanner service will be able to see stocks that qualify for that trading strategy in real time.
How Do You See the ATR Indicator in Your Trading Platform?
It depends on the trading platform you use, but most of them do allow you to enable the ATR indicator.
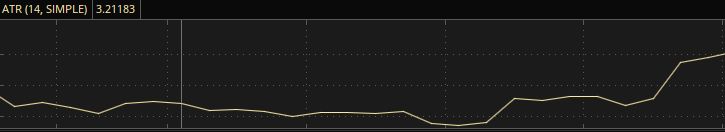
That image shows an example of how it looks in the Thinkorswim desktop trading platform. You can see that it's depicted as a numeric value that varies as time goes on.
To enable the ATR indicator in Thinkorswim, you right click the chart, select Studies from the drop down menu, then select Add Study, then click ATR.
For other trading platforms, the process might be different. But the concept might still be similar in that you're trying to find where you can toggle on and off their studies or indicators.
Learning More About ATR
You can contact us any time if you would like to ask any questions about ATR or anything else related to the stock market.
Join Our Free Email List
Get emails from us about ways to potentially make money in the stock market.
Stock Market Guides
You can trade without an edge, but why?
What We Offer
Stock Market Guides identifies stock trading opportunities that have a historical track record of profitability in backtests.
Average Annualized Return
43.1%