Death Cross in Stocks - Meaning and How Traders Use It
Stock Market Guides is not a financial advisor. Our content is strictly educational and should not be considered financial advice.
When it comes to the stock market, sometimes you might hear the term "death cross" mentioned. It refers to a stock indicator that is popular among active stock traders.
This article will explain what a death cross is and how traders might be able to benefit from finding one.
What Exactly Is a Death Cross?
A death cross is a stock indicator that is based on a type of moving average crossover.
A moving average crossover is a technical analysis tool used in stock market trading. It involves plotting two different moving averages on a price chart.
A moving average crossover occurs when two moving average lines on a stock chart intersect.
In the case of a death cross, the moving average crossover consists of two moving average lines: a 50-day moving average and a 200-day moving average.
This means that before the death cross occurs, the 50-day moving average is above the 200-day moving average. After the death cross, the 50-day moving average is below the 200-day moving average.
There are different types of moving averages, such as simple moving average lines and exponential moving average lines. A death cross can occur with any type of moving average line.
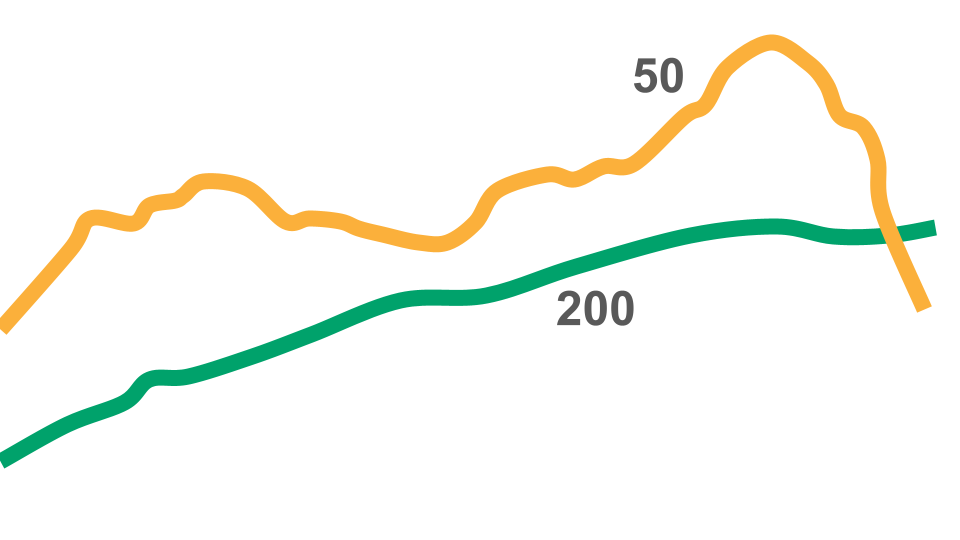
That image is a graphical icon that gives an idea visually of what a death cross looks like according to the depiction of moving average lines.
The death cross occurs when the golden "50" line crosses under the green "200" line.
Stock Market Guides
Stock Market Guides identifies swing trading opportunities that have a historical track record of profitability in backtests.
Average Annualized Return
79.4%
What Does a Death Cross Look Like On A Stock Chart?
The image below is an example of a stock chart where a death cross has occurred.
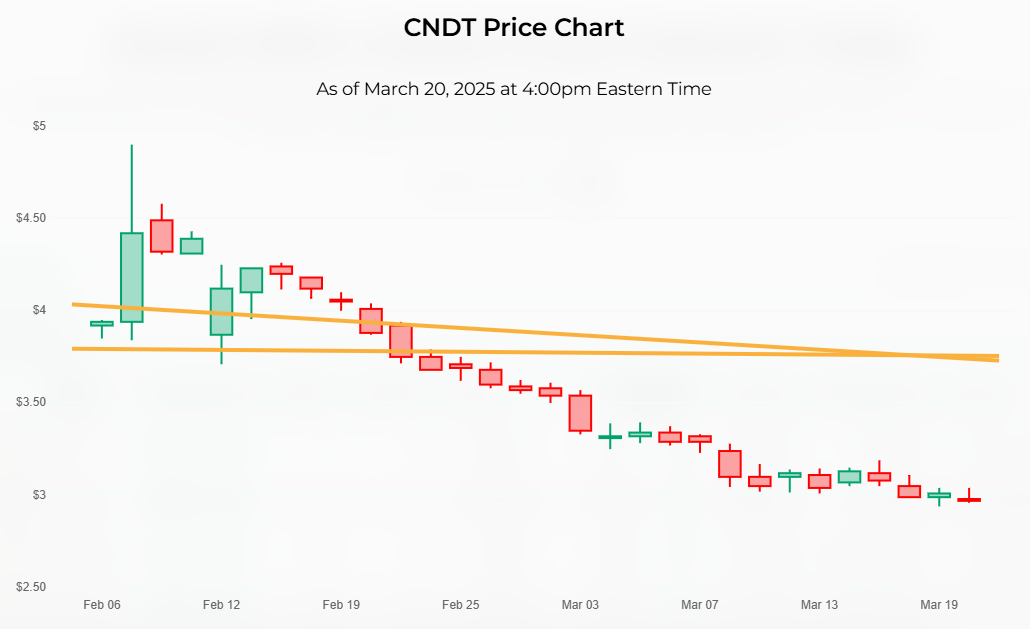
The price bars on a stock chart don't always make it obvious when a death cross has occurred. The reason is that the moving averages being used each cover a long period of time (50 days and 200 days, respectively), which means any individual day of price activity has a limited effect on either moving average's value.
In general, though, when looking at a chart over a larger time frame, one should expect to see that the prices are trending downward overall when a death cross occurs. The chart in the image above demonstrates that.
You can also see two golden lines on that chart. They represent the two respective moving averages, and you can see where they cross over each other.
How Do Traders Use a Death Cross?
The appearance of a death cross indicates that the stock's price has started trending downward in the last couple of months compared to where it had been on average in the year prior.
Some see this as a signal that the stock will continue its downtrend and therefore could be worthy of shorting. One can take advantage of this by simply shorting a stock that just had a death cross.
Others see this as a signal that the stock is due for a rebound after being beaten down in price recently, and therefore could be worthy of buying. One can take advantage of this by simply buying a stock that just had a death cross.
Is a Death Cross Bullish or Bearish?
Death crosses are typically considered bearish, meaning that they might be an indication that the stock price will continue its recent downward trend.
That said, our research suggests that over the long haul, shorting stocks with a death cross might not have been profitable historically. Our research of historical data offers more evidence that supports buying stocks that just had a death cross.
Therefore, death crosses might be considered by some to be bearish, but our research suggests they might actually be better suited as a bullish signal.
How Do You Find Stocks With a Death Cross?
You can find them by using our Death Cross scanner. It's a free tool we offer here at Stock Market Guides. It uses our proprietary scanning technology to find stocks with death crosses.
Here's how the scanner results look:
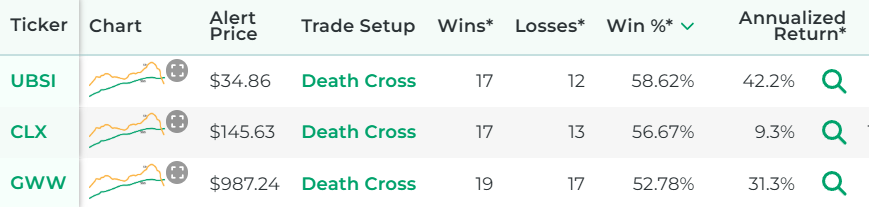
That tool ensures that you don't have to waste time flipping through stock charts manually to find death cross stocks.
Video About Death Cross
Here's a video that explains the death cross and gives examples:
Example of a Death Cross Trading Strategy
For this example of a death cross trading strategy, we're going to use a daily chart, where each price bar represents one day of price activity. That means it would be a swing trading strategy where the trade is designed to last more than one day but not for the long haul.
Entry for the Death Cross Trading Strategy
The entry for this Death Cross trading strategy will be as follows:
The entry criterion for our Death Cross trading strategy is very simple.
Exit for the Death Cross Trading Strategy
There are a lot of possibilities here for the exit.
For any given trading strategy, it can be helpful to define three different criteria for the exit: profit target, stop loss, and time limit.
Not everyone uses all three, and that's totally fine. Ultimately, you can set these values however you want. But for the purposes of this strategy example, we will define all three:
- Profit Target
We will set the profit target at 2 ATRs away from the entry price.
ATR is an indicator in the stock market that measures a stock's recent price volatility. Most trading platforms have it available as an indicator you can enable.
Our profit target criterion indicates that we will take the ATR value of the stock, multiply it by 2, and add it to the price we paid when we bought the stock. That will be our profit target and we can set up a sell limit order at that price.
- Stop Loss
We will set the stop loss at 3 ATRs below our entry price. This means we take the ATR value of the stock, multiply it by 3, and subtract it from our entry price.
That will be our stop loss and we can set up a stop order at that price.
- Time Limit
We will set the time limit as one week since this is a swing trade. If the stock has not hit either the profit target or stop loss by the time limit, then we will close the trade manually at the opening bell seven calendar days after entry.
How Well Do Death Crosses Actually Work?
The idea of a death cross trading strategy sounds nice to many people because it offers a clear, easy-to-understand way to find and manage a trade setup.
But does it actually work? Can traders indeed generate profits by buying stocks that have a death cross?
That's exactly what our company can help answer for you, since our scanner technology has allowed us to do our own research on that precise question.
The answer is that trades based on death crosses are not always profitable, but many times they are. For certain stocks, they might have a particularly strong track record of success according to our backtest research.
Here is some data that shows how a proprietary death cross trading strategy we created has performed historically according to backtests:
Wins
---
Losses
---
Win Percentage
---
Annualized Return
---
Anyone who signs up for our swing trading scanner service will be able to see stocks that qualify for that trading strategy in real time.
Learning More About Death Crosses
You can contact us any time if you would like to ask any questions about death crosses or anything else related to the stock market.
Join Our Free Email List
Get emails from us about ways to potentially make money in the stock market.
Stock Market Guides
You can trade without an edge, but why?
What We Offer
Stock Market Guides identifies swing trading opportunities that have a historical track record of profitability in backtests.
Average Annualized Return
79.4%