Dragonfly Doji Candlestick - How It Works and How Traders Can Use It
Stock Market Guides is not a financial advisor. Our content is strictly educational and should not be considered financial advice.
When it comes to the stock market, sometimes you might hear the term "dragonfly doji candle" mentioned. It refers to a type of stock chart candlestick that is popular among active stock traders.
This article will explain what a dragonfly doji candle is and how traders might be able to benefit from using it.
What Exactly Is a Dragonfly Doji Candle?
A dragonfly doji candle is a type of price candlestick found on a stock chart.
Stock charts show how a stock's price has changed over time, and that price activity can be conveyed in different ways. One of those ways is with price candlesticks, or price candles, which are also sometimes referred to as price bars.
Each price candle represents a pre-specified period of time, such as one day or one hour. Candles give information that might be pertinent to an investor, including the open price, close price, high price, and low price of the period.
A doji candle is a special type of price candle where the open price and close price are the same (or very close to it).
A dragonfly doji candle is a type of doji candle where the open and close prices are relatively high on the candle and close to the high price.
That image is a graphical icon that gives an idea visually of what a dragonfly doji candle looks like.
You can see that the body of the candle, whose height represents the difference between the open price and close price, is almost nonexistent. That means the open price is roughly equal to the close price of that candle. That's what makes it a doji candle.
Also, this candle looks like a cross where the horizontal line is near the high price. That's what makes it specifically a dragonfly type of doji candle.
Stock Market Guides
Stock Market Guides identifies swing trading opportunities that have a historical track record of profitability in backtests.
Average Annualized Return
79.4%
What Does a Dragonfly Doji Candle Look Like On A Stock Chart?
The image below is an example of a dragonfly doji candle as shown on one of our stock charts.
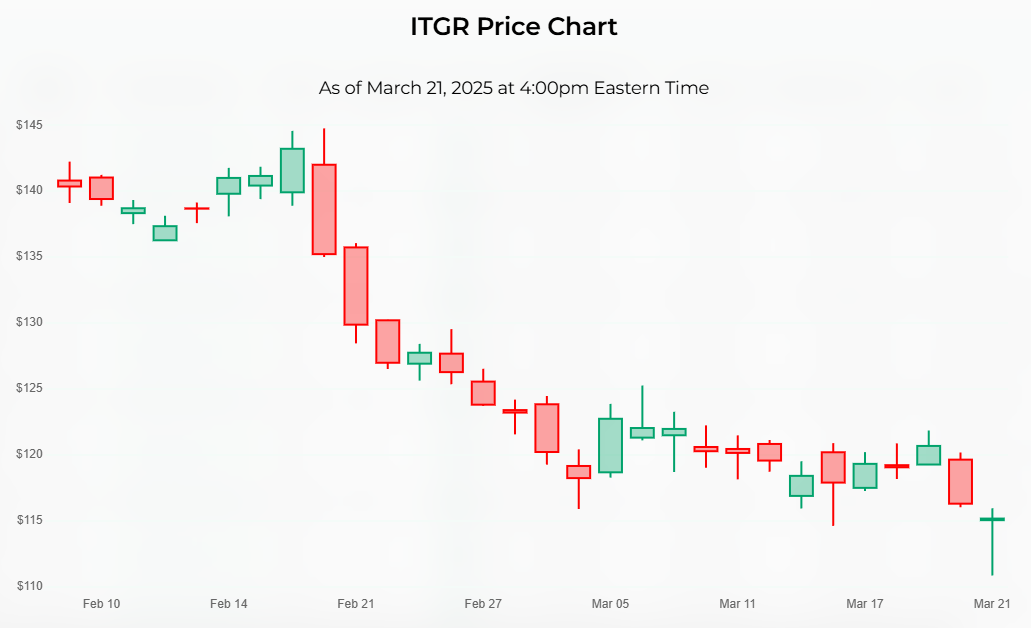
The dragonfly doji candle is the green one at the very far right of the stock chart, above the date of March 21.
The body of the candle is just a horizontal line with no height, and the horizontal line is near the highest price of the candle. Those are the telltale signs that it's a dragonfly doji candle.
Dragonfly doji candles come in a variety of sizes. That particular one is relatively tall.
How Do Traders Use a Dragonfly Doji Candle?
A dragonfly doji candlestick suggests that there was downward selling pressure at one point during the period, but by the end, buyers exerted enough power to bring the price back up. As a result, it might indicate a potential reversal of a downtrend or a slowing down of downtrend momentum.
This might be particularly true if there was a strong and forceful downtrend preceding the dragonfly doji candle. In that case, the dragonfly doji could be seen as the final gasp of the downtrend, and traders might anticipate a ramp-up period to follow price-wise.
Is a Dragonfly Doji Candle Bullish or Bearish?
A dragonfly doji is typically considered bullish, especially when following a downtrend. In other words, it is commonly seen as a potential reversal signal.
Some traders wait to see what happens with the price candle that follows a dragonfly doji to confirm their suspicion of it being bullish. If a green bar occurs afterward, that might be seen by some as the confirmation they're looking for.
If the stock has been in a downtrend, and then a dragonfly doji candle appears, a trader could try to capitalize by buying the stock.
How Do You Find Stocks That Have Dragonfly Doji Candlesticks?
You can find them by using our Dragonfly Doji Candle scanner. It's a free tool we offer here at Stock Market Guides. It uses our proprietary scanning technology to find stocks that just had a dragonfly doji candlestick on a daily chart.
Here's how the scanner results look:
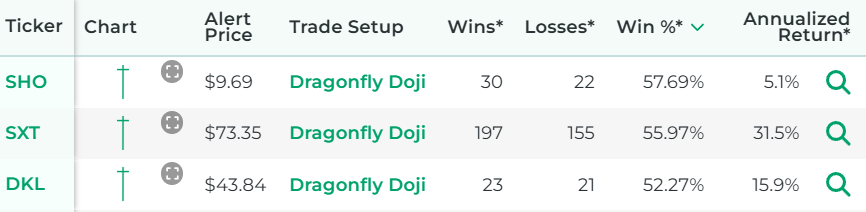
That tool ensures that you don't have to waste time flipping through stock charts manually to find stocks with a dragonfly doji candle.
Example of a Dragonfly Doji Candle Trading Strategy
For this example of a dragonfly doji candle trading strategy, we're going to use a daily chart, where each price candle represents one day of price activity. That means it would be a swing trading strategy where the trade is designed to last more than one day but not for the long haul.
Entry for the Dragonfly Doji Candle Trading Strategy
The entry for this Dragonfly Doji Candle trading strategy will be as follows:
The entry criterion for our Dragonfly Doji Candle trading strategy is very simple.
Exit for the Dragonfly Doji Candle Trading Strategy
There are a lot of possibilities here for the exit.
For any given trading strategy, it can be helpful to define three different criteria for the exit: profit target, stop loss, and time limit.
Not everyone uses all three, and that's totally fine. Ultimately, you can set these values however you want. But for the purposes of this strategy example, we will define all three:
- Profit Target
We will set the profit target at 1.5 ATRs away from the entry price.
ATR is an indicator in the stock market that measures a stock's recent price volatility. Most trading platforms have it available as an indicator you can enable.
Our profit target criterion indicates that we will take the ATR value of the stock, multiply it by 1.5, and add it to the price we paid when we bought the stock. That will be our profit target, and we can set up a sell limit order at that price.
- Stop Loss
We will set the stop loss at 3 ATRs below the entry price. This means we take the ATR value of the stock, multiply it by 3, and subtract it from the price we paid to buy the stock.
That will be our stop loss, and we can set up a stop order at that price.
- Time Limit
We will set the time limit as one week since this is a swing trade. If the stock has not hit either the profit target or stop loss by the time limit, then we will close the trade manually at the opening bell seven calendar days after entry.
How Well Do Dragonfly Doji Candles Actually Work?
The idea of a dragonfly doji candle trading strategy sounds nice to many people because it offers a clear, easy-to-understand way to find a trade setup.
But does it actually work? Can traders indeed generate profits by trading dragonfly doji candles?
That's exactly what our company can help answer for you, since our scanner technology has allowed us to do our own research on that precise question.
The answer is that trades based on a dragonfly doji candle are not always profitable, but for certain stocks they might indeed have a track record of success according to our backtest research.
Here is some data that shows how a proprietary dragonfly doji candle trading strategy we created has performed historically according to backtests:
Wins
---
Losses
---
Win Percentage
---
Annualized Return
---
Anyone who signs up for our swing trading scanner service will be able to see stocks that qualify for that trading strategy in real time.
Learning More About Dragonfly Doji Candles
You can contact us any time if you would like to ask any questions about dragonfly doji candlesticks or anything else related to the stock market.
Join Our Free Email List
Get emails from us about ways to potentially make money in the stock market.
Stock Market Guides
You can trade without an edge, but why?
What We Offer
Stock Market Guides identifies swing trading opportunities that have a historical track record of profitability in backtests.
Average Annualized Return
79.4%