Stocks With a Dragonfly Doji Candlestick Today
Stock Market Guides is not a financial advisor. Our content is strictly educational and should not be considered financial advice.
The stocks below are each ones that just exhibited a dragonfly doji candlestick according to our stock scanner. You can sort columns or add filters in order to fine-tune the scan results.
As of April 17, 2025 at 3:11am Eastern Time
*Wins, Losses, Win Percentage, and Annualized Return are referring to how the stock performed in backtests for the Trade Setup indicated.
How to Use Our Scanner for Dragonfly Doji Candle Stocks
The above list represents stocks that have dragonfly doji candles today.
It's powered by our proprietary stock scanner, which searches once per day for stocks that have dragonfly doji candles.
You can sort columns using the up and down arrows next to the column name. You can add filters for the column values by clicking the "Add Filter" button above the list of dragonfly doji candle stocks. This scanner is designed for active stock traders.
This video shows how to use our scanner:
Scanner Features that Require a Subscription
Our free scanner offers you the ability to find stocks that have dragonfly doji candles, but you may need more than that to ensure you're making trades that have a true edge.
Our paid scanner service is designed to offer you all the intelligence our research can offer. These are the scanner features you get if you pay for a subscription:
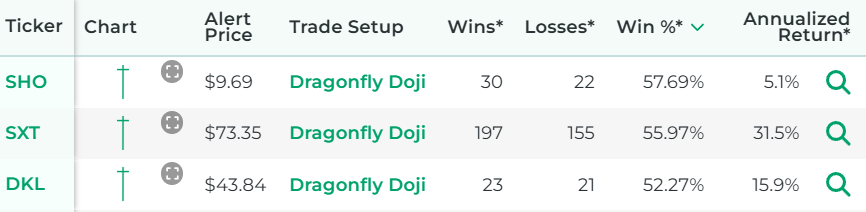
- See the historical backtested performance for each scan result. It looks like this:
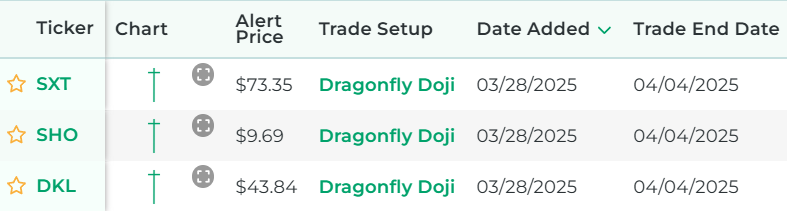
- See full trade setups for each scan result, including when to enter and exit. It looks like this:
- Get alerted when there are new scan results (by text or email).
- Get access to real-time scan updates throughout the trading day.
- Access scan results for all trading strategies in a single scan to easily see which trade setups have the best backtested performance across the entire market at any given time.
- Get access to scan results for our proprietary trading strategies, which required years of research to develop.
- Find Stock Trade Setups That Have a Backtested Edge
- Based on Technicals Like Chart Patterns and Indicators
Here's a video that explains the difference between our free dragonfly doji candle scanner and our paid scanner service:
Stock Market Guides
Stock Market Guides identifies swing trading opportunities that have a historical track record of profitability in backtests.
Average Annualized Return
79.4%
What Exactly Is a Dragonfly Doji Candle?
A dragonfly doji candle is a type of price candlestick found on a stock chart.
Stock charts show how a stock's price has changed over time, and that price activity can be conveyed in different ways. One of those ways is with price candlesticks, or price candles, which are also sometimes referred to as price bars.
Each price candle represents a pre-specified period of time, such as one day or one hour. Candles give information that might be pertinent to an investor, including the open price, close price, high price, and low price of the period.
A doji candle is a special type of price candle where the open price and close price are the same (or very close to it).
A dragonfly doji candle is a type of doji candle where the open and close prices are relatively high on the candle and close to the high price.

That image is a graphical icon that gives an idea visually of what a dragonfly doji candle looks like.
You can see that the body of the candle, whose height represents the difference between the open price and close price, is almost nonexistent. That means the open price is roughly equal to the close price of that candle. That's what makes it a doji candle.
Also, this candle looks like a cross where the horizontal line is near the high price. That's what makes it specifically a dragonfly type of doji candle.
How We Find Dragonfly Doji Candle Stocks Each Day
Our one-of-a-kind scanning technology is at the heart of everything we do here. We have a way to program a trading strategy into our scanner, and then it uses real-time data feeds to find any stocks that meet the criteria of the trading strategy.
In the case of finding stocks that have dragonfly doji candles each day, our scanner looks for stocks where the most recent day's price candlestick has the characteristics of a dragonfly doji candle.
Our Criteria for Defining Dragonfly Doji Candle Stocks
To find stocks that have dragonfly doji candles, our scanner looks for stocks where the most recent price bar has an open that's almost exactly the same as its close, where the upper wick is relatively small, and where the lower wick is relatively tall.
Other Popular Scans at Stock Market Guides
Want to see scans we have for other popular indicators, chart patterns, and candlestick patterns? Check them out here:


Have Questions About Dragonfly Doji Candle Stocks or Our Services?
If you have questions about stocks with dragonfly doji candles or questions about any services we offer, you can contact us any time and we'll be ready to help.
Join Our Free Email List
Get emails from us about ways to potentially make money in the stock market.
Stock Market Guides
You can trade without an edge, but why?
What We Offer
Stock Market Guides identifies swing trading opportunities that have a historical track record of profitability in backtests.
Average Annualized Return
79.4%