Stock Candlestick Patterns
Learn stock candlestick patterns here and access our free scanner that shows which stocks exhibit these candlestick patterns right now. You'd have to upgrade to our paid service to see the historical backtested performance of the candlestick patterns for each stock.
Candlestick Pattern Quick Guide


To get alerts when stocks exhibit any of these candlestick patterns, you can sign up for our Swing Trading Service.
Hammer Candle

Look of the Candle:
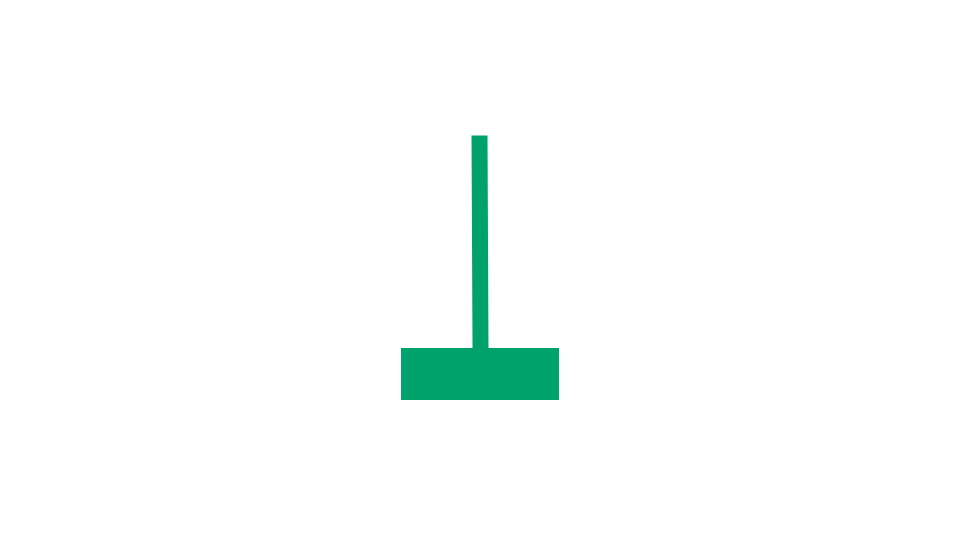
The hammer candlestick looks like the side view of a hammer. It has a long handle (the lower wick) and the body of the candle is short and at the very top of the price bar.
Finding Stocks With This Candle:
You can see which stocks have this candle today by using our Hammer Candle scanner.
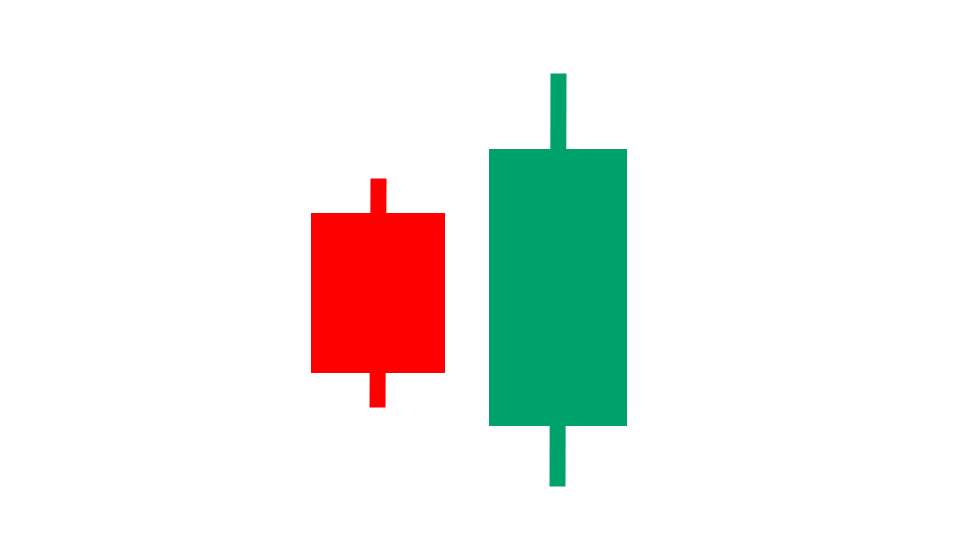
Bullish Engulfing Pattern

Look of the Pattern:
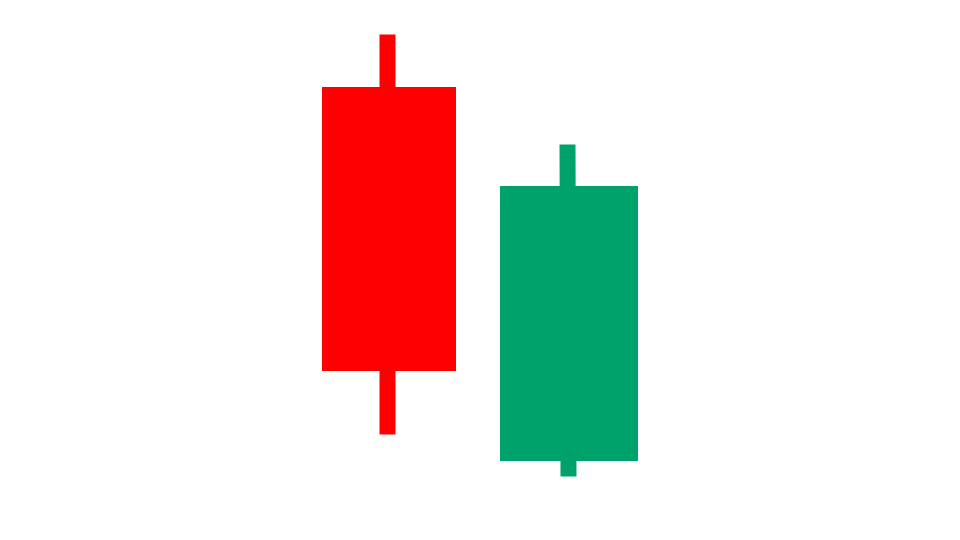
The bullish engulfing candlestick pattern is one where the first candle is red and the second candle is green. The second candle's body engulfs the body of the first candle.
Finding Stocks With This Pattern:
You can see which stocks are in this pattern today by using our Bullish Engulfing scanner.
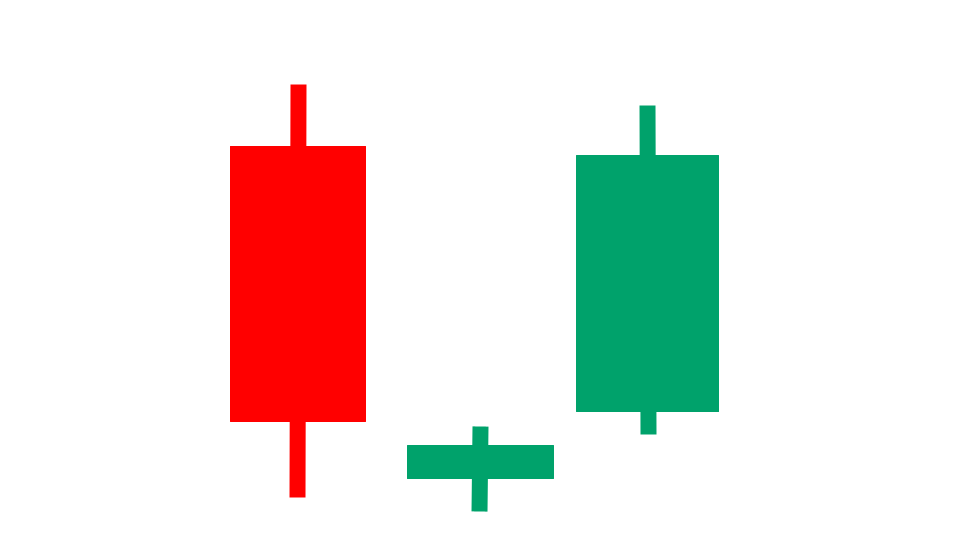
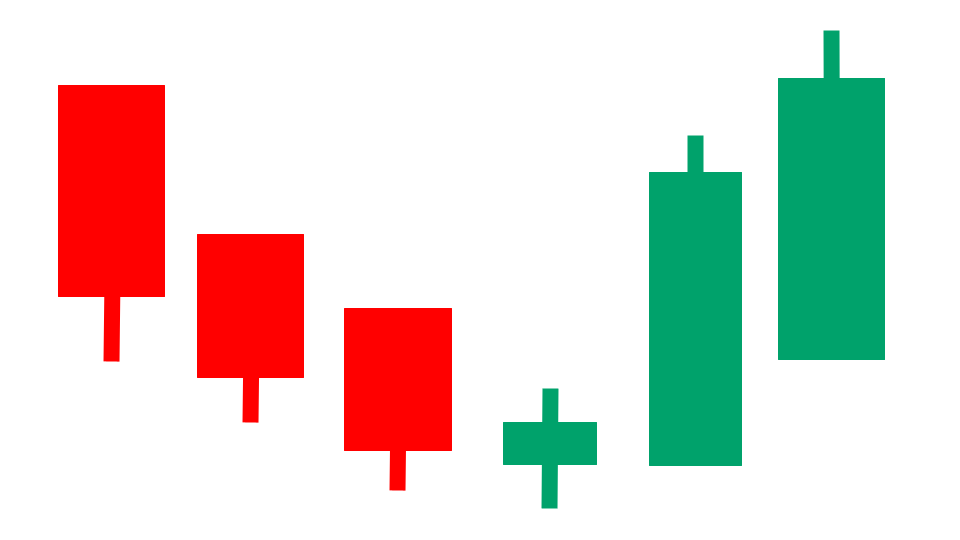
Morning Star Pattern

Look of the Pattern:
There are three candles in the morning star candlestick pattern. The first is a big red one. The second is a small one whose body is below the bodies of the first and third candles. The third candle is a big green one.
Finding Stocks With This Pattern:
You can see which stocks are in this pattern today by using our Morning Star scanner.
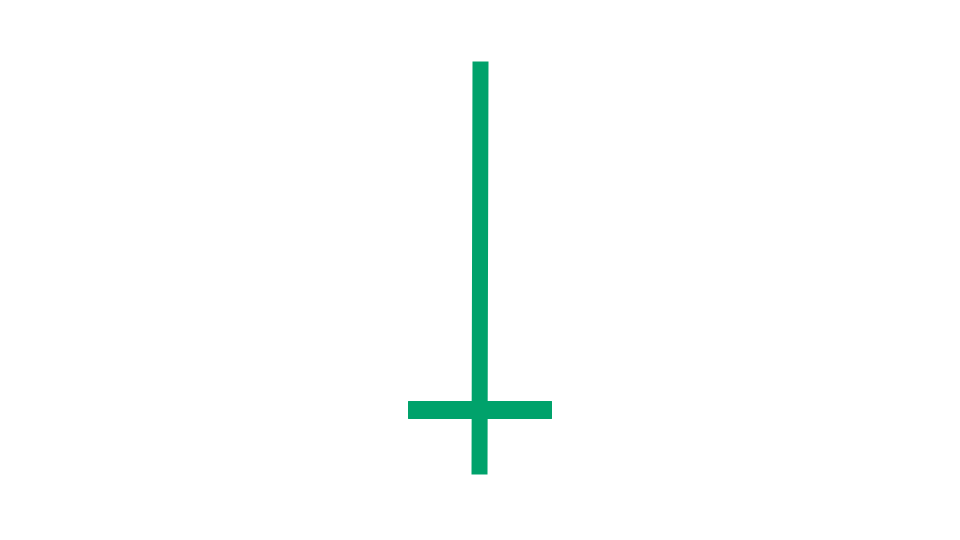
Dragonfly Doji
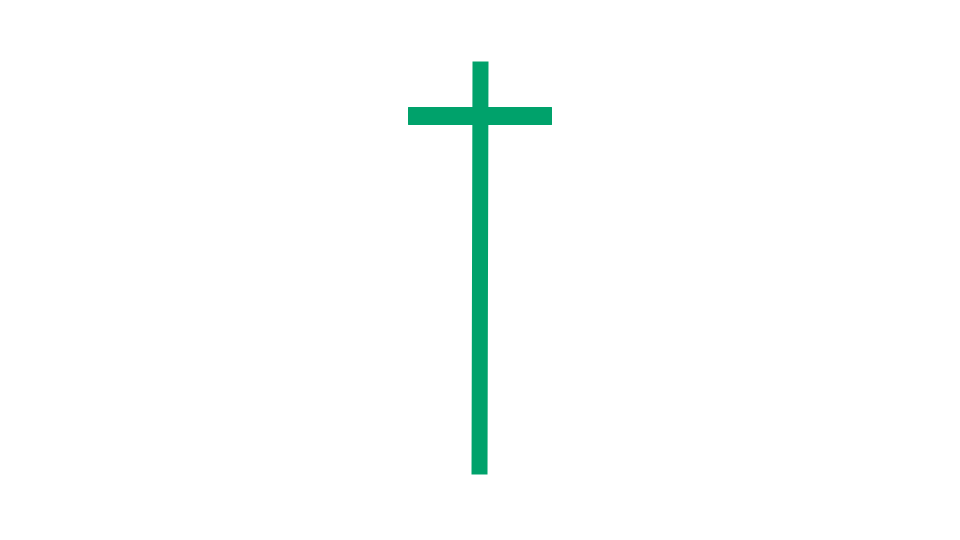
Look of this Candle:
The dragonfly doji candle is tall. It's a type of doji candle, which means that the open price is roughly the same as the close price. The open and closing prices are near the top of the candle.
Finding Stocks With This Candle:
You can see which stocks have this candle today by using our Dragonfly Doji scanner.
Piercing Candlestick Pattern
Look of the Pattern:
A piercing candlestick pattern occurs when there is a red bar and then the price gaps down and leads to a green bar that closes higher than the halfway point of the body of the red bar.
Finding Stocks With This Pattern:
You can see which stocks are in this pattern today by using our Piercing Pattern scanner.
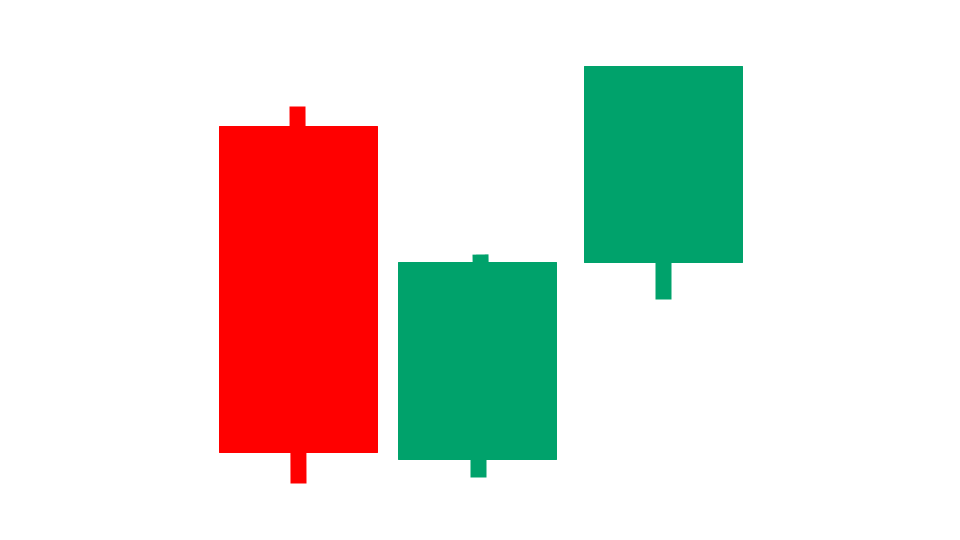
Three Inside Up Pattern

Look of Pattern:
A three inside up candlestick pattern consists of three candles. The first is a large red bar. The second is a green bar that closes above the halfway point of the body of the red bar. The third is a green bar that closes above the top of the red bar.
Finding Stocks With This Pattern:
You can see which stocks are in this pattern today by using our Three Inside Up Pattern scanner.
Inverted Hammer Candle
Look of the Candle:
The inverted hammer candle looks like the side view of a hammer that's upside down. It has a long handle (the upper wick) and the body of the candle is short and at the very bottom of the price bar.
Finding Stocks With This Candle:
You can see which stocks have this candle today by using our Inverted Hammer candle scanner.
Long Legged Doji Candle
Look of the Candle:
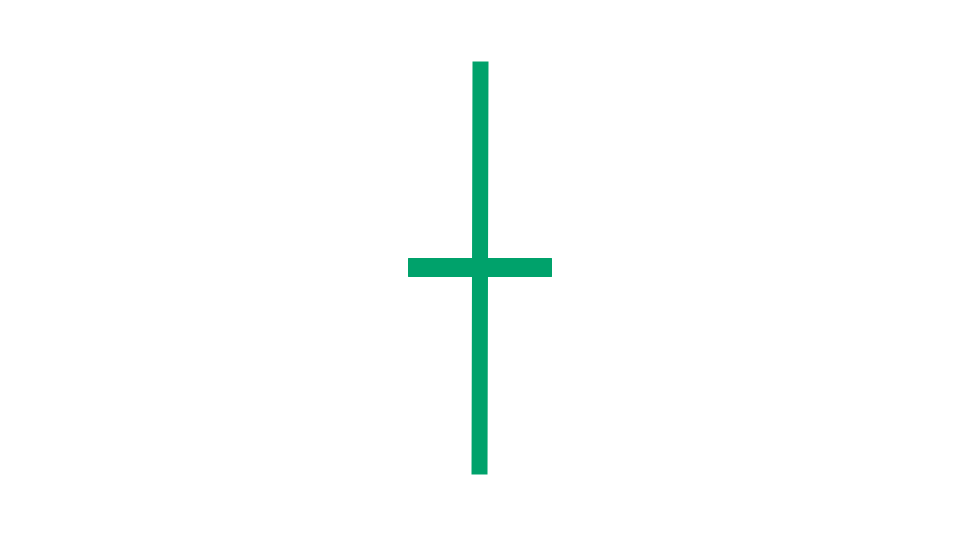
The long-legged doji candle has an open price that is roughly the same as the close price. The open and closing prices are near the middle of the candle.
Finding Stocks With This Candle:
You can see which stocks have this candle today by using our Long Legged Doji scanner.
Three Outside Up Pattern
Look of the Pattern:
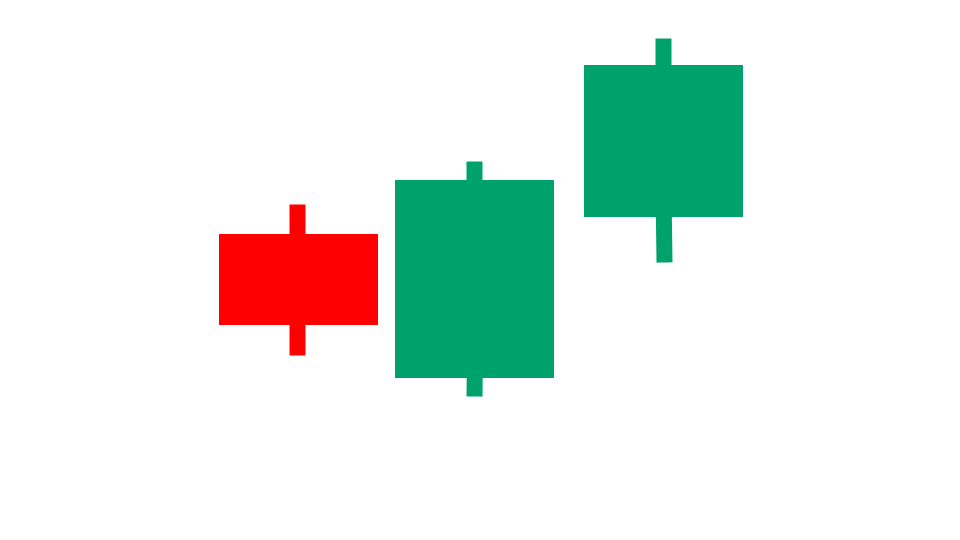
A three outside up candlestick pattern consists of three candles. The first is a small red bar. The second is a green bar with a body that envelopes the body of the red bar. The third is a green bar that closes above the top of the prior green bar.
Finding Stocks With This Pattern:
You can see which stocks are in this pattern today by using our Three Outside Up Pattern scanner.
Bullish Harami Pattern
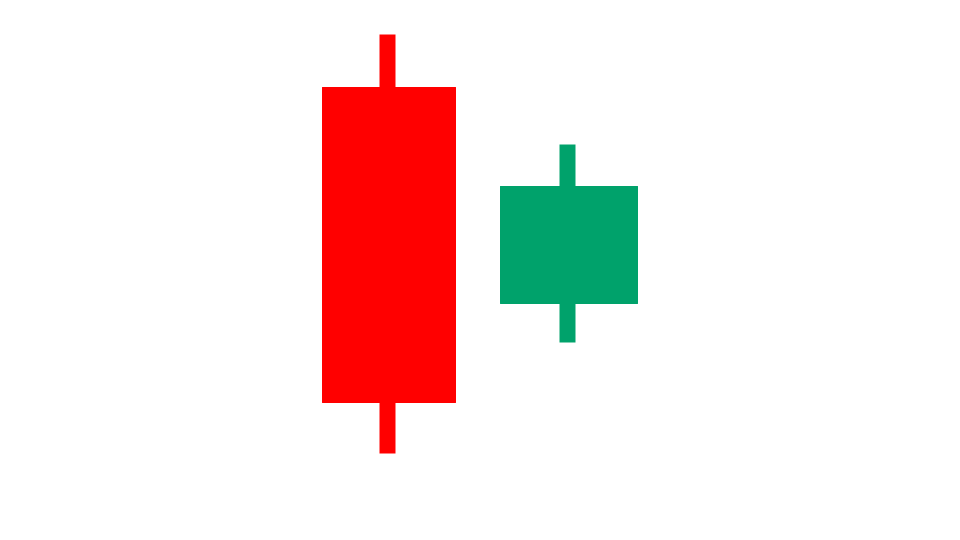
Look of the Pattern:
A bullish harami candlestick pattern consists of two bars. The first bar is a big red bar that envelopes the entire second bar. The second bar is a green bar.
Finding Stocks With This Pattern:
You can see which stocks are in this pattern today by using our Bullish Harami Pattern scanner.
Doji Candles
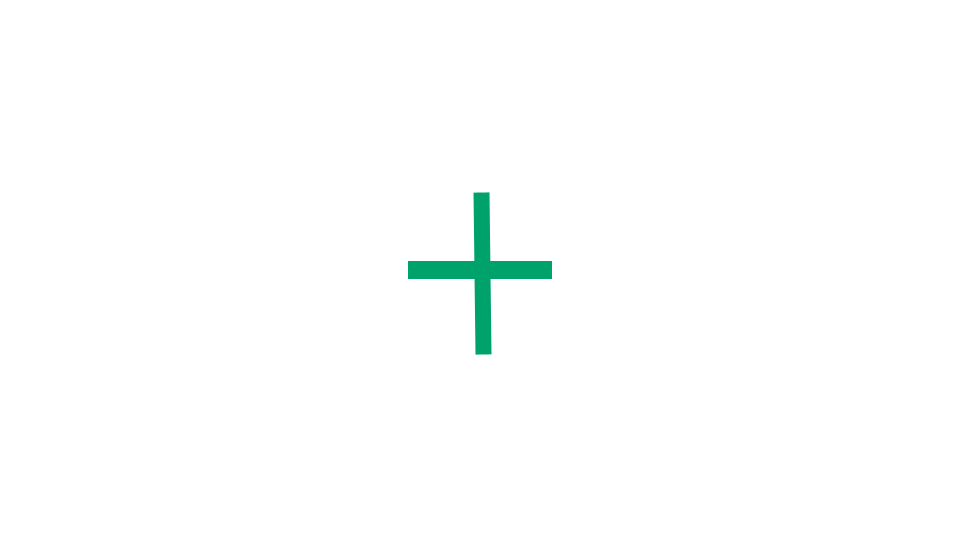
Look of the Candle:
A doji candle is one where the open price is roughly the same as the close price. The doji candle comes in many sizes and structures.
Finding Stocks With This Candle:
You can see which stocks have this candle today by using our Doji candlestick scanner.
Gravestone Doji Candle
Look of the Candle:
The gravestone doji candle is typically tall. It's a doji candle, which means that the open price is roughly the same as the close price. The open and closing prices are near the middle of the candle.
Finding Stocks With This Candle:
You can see which stocks have this candle today by using our Gravestone Doji scanner.
Heikin Ashi Breakout Pattern
Look of the Pattern:
Heikin Ashi refers to a special type of price candle. Heikin Ashi breakouts have a lot of different looks, but they occur when the Heikin Ashi candles go from red to green.
Finding Stocks With This Pattern:
You can see which stocks are in this pattern today by using our Heikin Ashi scanner.
To get alerts when stocks exhibit any of these candlestick patterns, and to see how they performed historically in backtests for each stock, you can sign up for our Swing Trading Service.
Candlestick Pattern Scanner
Our Swing Trading Service includes access to our proprietary swing trading scanner technology. Our candlestick pattern scanner identifies trade opportunities that have a backtested edge. Here at Stock Market Guides, our specialty is bringing data and statistics to your trading decisions. With every stock trade setup that comes up in our candlestick pattern scanner, you’ll be able to see exactly how that trade setup has performed historically in backtests. This allows traders to make fully informed trading decisions. There’s no longer a need to take a blind leap of faith when making a stock trade.
How Our Candlestick Scanner Works
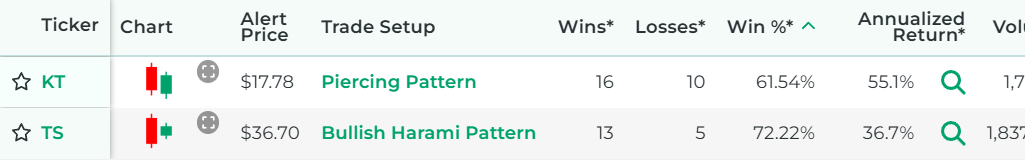
Here’s an example of what the results look like from our candlestick pattern scanner. You can see that each scan reflects a specific swing trading strategy based on a stock candlestick pattern. Each scan result shows not only the stock, but also how the stock performed historically for that trading strategy according to our backtest research.
Features of Our Candlestick Pattern Scanner
Shows Historical Performance
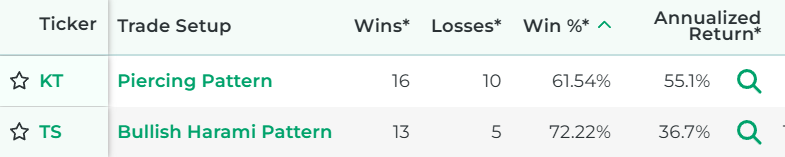
What makes our stock scanner one-of-a-kind is that each scan result shows how that stock performed in backtests when the candlestick pattern occurred in the past. Why waste time or money considering candlestick patterns that don’t have a track record of success?

Gives Complete Trade Setups
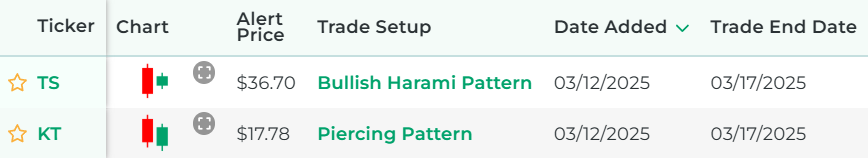
Each scan result offers a full trade setup based on the candlestick pattern our scanner identified. It gives you a specific amount of time to hold the position. This takes the guesswork out of your trading decisions. You know exactly how long to hold the position.
Get Alerts for New Scan Results
If you pay for our service, then you can enable alerts for any candlestick pattern scans you want. This means you will get alerted each time our scanner finds new stock candlestick patterns that have a backtested edge. Alerts can be sent by email or text. You can set your preference after you sign up for the service.

- Find Stock Trade Setups That Have a Backtested Edge
- Has DIY Swing Trading Scanner
- Get Swing Trade Picks from Our Scanner: 79.4% Average Annualized Return in Backtests
FAQs about Stock Candlestick Patterns
Here are frequently-asked questions about stock candlestick patterns and why they might be important to investors.
What exactly is a stock candlestick pattern?
Candlesticks, sometimes referred to as price candles, are representations on a stock chart that depict the price movements of a stock. Each candlestick on a chart represents four key prices during that period: the opening price, the closing price, the highest price, and the lowest price. A stock candlestick pattern refers to a distinct and recognizable formation of price candles.
What is an example of a stock candlestick pattern?
Many stock candlestick patterns have well-known names such as “Hammer," "Gravestone Doji," and "Shooting Star." This image is an example of a Morning Star candlestick pattern.

Why do stock candlestick patterns matter?
A stock chart has price candles that show how a stock's price is changing over time. The candles can be seen as a reflection of buying and selling pressure for a stock. When the price fluctuates in a way that depicts a particular candlestick pattern, it means that the buying and selling pressure might give us insights about where the stock price is headed next. This information can be used to potentially profit from buying or selling the stock. Candlestick patterns are especially popular among active traders, such as swing traders.
How can you use stock candlestick patterns to make trading decisions?
What's nice about stock candlestick patterns is that each one has its own rules for what constitutes the pattern and also what would trigger a "buy" signal. So in other words, the pattern itself dictates the trade parameters. As a result, stock candlestick patterns make it relatively easy to determine when it's time for a trading decision. The challenging part is that not all candlestick patterns are created equal. Some perform better than others, and some stocks in particular have a good track record with particular candlestick patterns. That's the piece of the equation that we put at your fingertips with our paid service. We show you the backtested performance of each candlestick pattern.
Which are the best stock candlestick patterns?
Perhaps the best candlestick patterns are the ones that have the strongest track record of success. If you sign up for our service, you'll see the historical backtested performance of each stock candlestick pattern in real time as it occurs. This might help you decide which candlestick patterns are worth taking action on.
How do you know if a candlestick pattern is bullish or bearish?

It's not always intuitive from a candlestick pattern whether it's bullish or bearish. The image here, for example is of a bullish Harami pattern, but that may not be obvious or intuitive just from looking at the pattern alone. You can tell if a stock candlestick pattern is bullish or bearish by looking at the way we group them on this page. Also, if you click the link for any given candlestick pattern, it will indicate whether it is a bullish or bearish pattern.
As Seen On


Customer Testimonials
The service you provide appears to be exactly as advertised. Without exaggeration, thus far your service has cut my research time by at least 35% - 40%. Regards from a happy user.
Dennis from Florida
I'm making money, that's what matters. Well worth the $70 per month. I hope to, and plan to, use your service for as long as you'll have me.
James from Alabama
This is a great platform was able to make some profit, also enabled me to learn and understand candles.
Jimmy from Texas
Absolutely love your service. I've found your service to be excellent and will recommend it.
Jason from California
Join Our Free Email List
Get emails from us about ways to potentially make money in the stock market.