Mean Reversion in Stocks - Meaning and How Traders Use It
Stock Market Guides is not a financial advisor. Our content is strictly educational and should not be considered financial advice.
When it comes to the stock market, sometimes you might hear the term "mean reversion" mentioned. It refers to how a stock's price might move compared to certain stock indicators that are popular among active stock traders.
This article will explain what mean reversion is and how traders might be able to benefit from finding stocks that exhibit them.
What Exactly Is Mean Reversion?
The word "mean" is another word for "average". So when someone talks about mean reversion, they're talking about the price of a stock returning to its average price.
A trader in the stock market might use a moving average line on a stock chart to signify the average price. If the stock's price gets noticeably far removed from that average price, a trader might anticipate mean reversion, meaning that the stock price might reverse course and gravitate back to that moving average line.
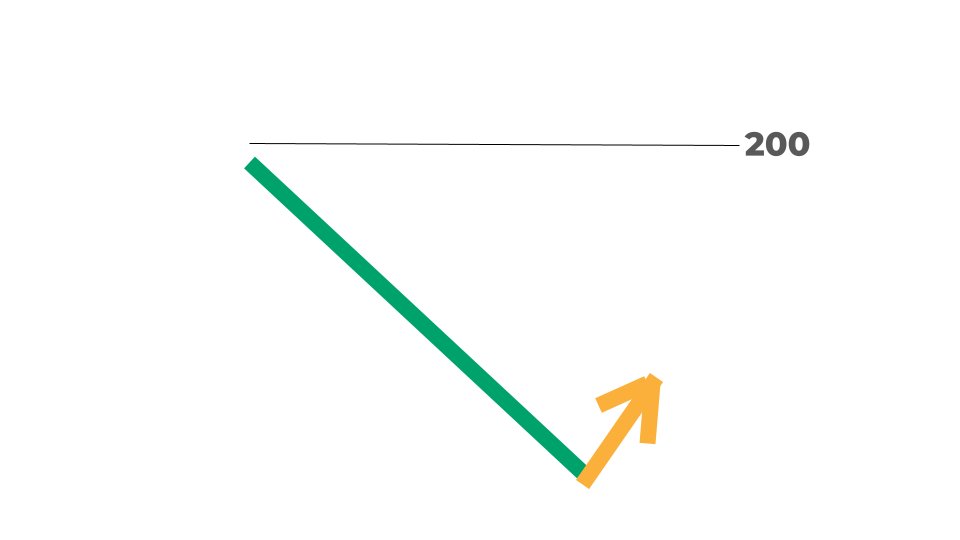
That image is a graphical icon that gives an idea visually of what a mean reversion looks like on a stock chart.
The line that says "200" represents a moving average line, which signifies the average price (or mean). The green line represents the price of the stock as it gets noticeably removed from the moving average line.
The yellow arrow represents a point when a trader might think the stock could be due for mean reversion. The trader anticipates that the stock price could go back up from this point toward the average.
Stock Market Guides
Stock Market Guides identifies swing trading opportunities that have a historical track record of profitability in backtests.
Average Annualized Return
79.4%
What Does a Mean Reversion Look Like On A Stock Chart?
The image below is an example of a stock chart where a stock is far extended from its moving average line and might be due for mean reversion:
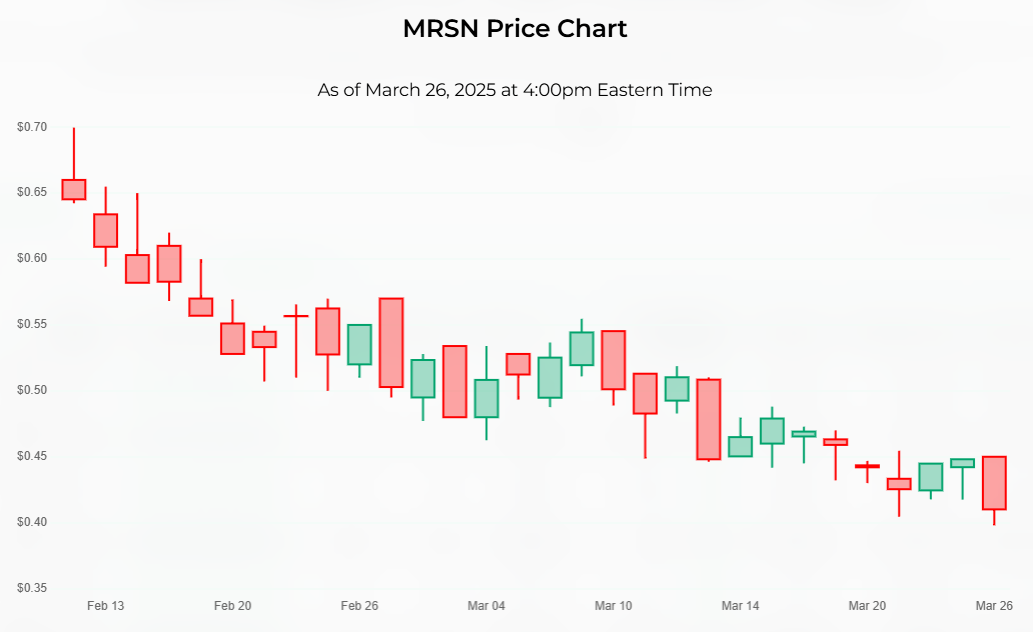
The price bars on a stock chart don't always make it obvious when a mean reversion is due, as it depends on which average price is being considered.
In the case of this chart, though, it's apparent that the stock has gone down a lot in price. Not pictured on the chart is the 200-period moving average, which is well above any prices shown on the chart.
A trader might anticipate that the stock price could go back up to that moving average, and therefore reverse the downtrend seen on the chart.
How Do Traders Use Mean Reversion?
Mean reversion trading is making trades in anticipation of a price reversal. If a stock is too far removed from its average price, it might be like a rubber band that's been stretched really far. The stock price could eventually snap back.
Traders take advantage of this by simply buying a stock that has a price well below its moving average, or shorting a stock that has a price well above its moving average. It's a relatively easy trading strategy to implement.
Opportunities to profit from mean reversion might show up in a variety of ways, such as different chart time frames or different moving average periods. For example, one trader might compare the current price to a 10-day moving average, while another might compare the current price to a 200-day moving average.
Is a Mean Reversion Bullish or Bearish?
Mean reversions can be bullish or bearish, depending on which way the price has deviated from the moving average.
If the price is way below its average, that could be considered bullish, and a potential signal to buy the stock.
If the price is way above its average, that could be considered bearish, and a potential signal to sell or short the stock.
How Do You Find Stocks Eligible For Mean Reversion?
You can find them by using our Mean Reversion scanner. It's a free tool we offer here at Stock Market Guides. It uses our proprietary scanning technology to find stocks due for potential mean reversion.
Here's how the scanner results look:
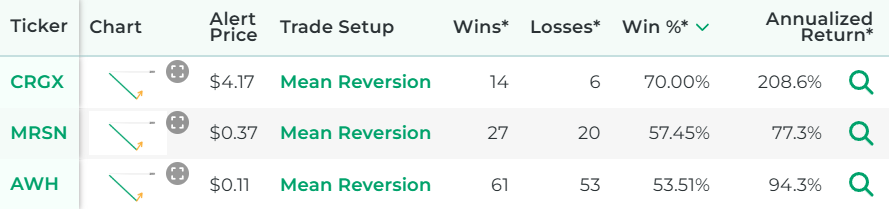
That tool ensures that you don't have to waste time flipping through stock charts manually to find mean reversion stocks.
Example of a Mean Reversion Trading Strategy
For this example of a mean reversion trading strategy, we're going to use a daily chart, where each price bar represents one day of price activity. That means it would be a swing trading strategy where the trade is designed to last more than one day but not for the long haul.
Entry for the Mean Reversion Trading Strategy
The entry for this Mean Reversion trading strategy will be as follows:
The entry criterion for our Mean Reversion trading strategy is very simple.
Exit for the Mean Reversion Trading Strategy
There are a lot of possibilities here for the exit.
For any given trading strategy, it can be helpful to define three different criteria for the exit: profit target, stop loss, and time limit.
Not everyone uses all three, and that's totally fine. Ultimately, you can set these values however you want. But for the purposes of this strategy example, we will define all three:
- Profit Target
We will set the profit target at 3 ATRs away from the entry price.
ATR is an indicator in the stock market that measures a stock's recent price volatility. Most trading platforms have it available as an indicator you can enable.
Our profit target criterion indicates that we will take the ATR value of the stock, multiply it by 3, and add it to the price we paid when we bought the stock. That will be our profit target, and we can set up a sell limit order at that price.
- Stop Loss
We will set the stop loss at 3 ATRs below our entry price. This means we take the ATR value of the stock, multiply it by 3, and subtract it from our entry price.
That will be our stop loss, and we can set up a stop order at that price.
- Time Limit
We will set the time limit as one month since this is a swing trade. If the stock has not hit either the profit target or stop loss by the time limit, then we will close the trade manually at the opening bell seven calendar days after entry.
How Well Do Mean Reversion Trades Actually Work?
The idea of a mean reversion trading strategy sounds nice to many people because it offers a clear, easy-to-understand way to find and manage a trade setup.
But does it actually work? Can traders indeed generate profits by buying stocks that might be due for mean reversion?
That's exactly what our company can help answer for you, since our scanner technology has allowed us to do our own research on that precise question.
The answer is that trades based on mean reversions are not always profitable, but many times they are. For certain stocks, they might have a particularly strong track record of success according to our backtest research.
Here is some data that shows how a proprietary mean reversion trading strategy we created has performed historically according to backtests:
Wins
---
Losses
---
Win Percentage
---
Annualized Return
---
Anyone who signs up for our swing trading scanner service will be able to see stocks that qualify for that trading strategy in real time.
Learning More About Mean Reversions
You can contact us any time if you would like to ask any questions about mean reversions or anything else related to the stock market.
Join Our Free Email List
Get emails from us about ways to potentially make money in the stock market.
Stock Market Guides
You can trade without an edge, but why?
What We Offer
Stock Market Guides identifies swing trading opportunities that have a historical track record of profitability in backtests.
Average Annualized Return
79.4%