What Is a Support Level in Stocks?
Stock Market Guides is not a financial advisor. Our content is strictly educational and should not be considered financial advice.
When it comes to active trading in the stock market, one of the most common terms you'll hear is "support level".
Someone might be talking about buying a stock at support. Or they might be talking about how a particular price point looks like it could be a support level.
If you want to know what a support level is and see how it looks on a stock chart, then you're in the right place. We'll cover that right here.
What Exactly is a Support Level?
A support level in stocks refers to a specific price level on a stock chart where the stock's price tends to find buying interest and prevents the price from falling further. It is also known as a "swing low."
In other words, it's a point where the stock's price has stopped decreasing and starts to bounce back up. It's visible as a chart pattern on a stock chart.
Stock Market Guides
Stock Market Guides identifies swing trading opportunities that have a historical track record of profitability in backtests.
Average Annualized Return
79.4%
Example of a Support Level
The image below shows an example of support level on a stock chart.
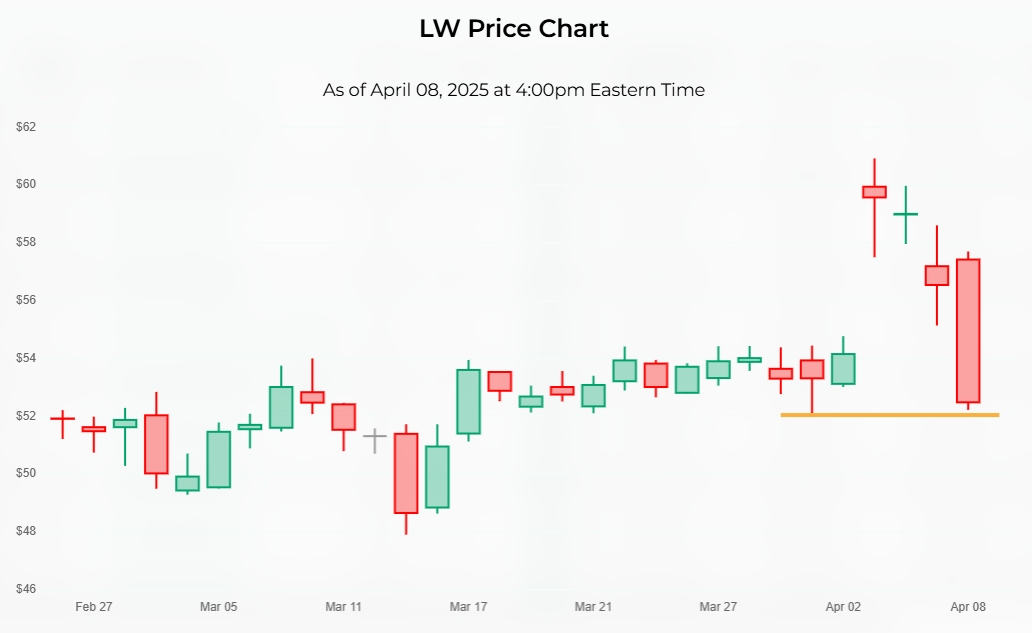
That chart shows the price activity for Lamb Weston stock.
The yellow line on that image indicates the support level. It connects the price bar where the support level was first established and the most recent bar, which is now near that same price level.
How Do You Find a Support Level on a Stock Chart?
To find support levels on a stock chart, you can follow these steps:
Look for Price Valleys or Low Points
A support level is identified by finding areas on the stock chart where the price forms valleys or bottom points. These are points where the price activity has stopped decreasing and starts to turn upward.
Observe Higher Lows
To confirm that any given point is a support level, check the two price bars on either side of the low point. If these price bars have higher lows, it indicates the presence of a support level. In other words, the low of the valley should be lower than the lows of the adjacent price bars.
Identify Distinct Lows
While there might be several potential support levels on a stock chart, look for the lowest price point among a group of nearby candles. The support level should stand out as having the lowest price relative to its neighboring price bars.
Pay Attention to V-shaped Patterns
Some support levels may form clear V-shaped patterns, where the price drops to a low point and then sharply rises again. These pronounced V-shaped patterns are often easier to recognize as support levels.
Video About Support Levels
This video we made about stock market support levels might help improve your understanding:
How Do You Identify the Importance of a Support Level?
The magnitude of a support level can be determined by its distinctiveness and prominence on the stock chart.
The more pronounced the valley or bottom tip of the V, the more important the support level is commonly thought to be.
If the support level is made up of a single short wick, it may not carry much weight. If, on the other hand, it's made up of a tall V-shaped price pattern, that might be considered an important support level.
Some investors believe that the more important the price level, the better the odds of making a profit from trading against it.
Measuring the magnitude of a support level is subjective to a large extent, and different investors may have varying interpretations based on their perspectives.
How Do You Find Stocks at Support Levels?
You can find them by using our Support Level scanner. It's a free tool we offer here at Stock Market Guides. It uses our proprietary scanning technology to find stocks at their support levels.
Here's how the scanner results look:
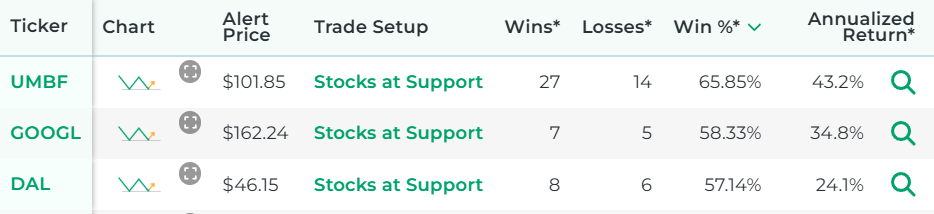
That tool ensures that you don't have to waste time flipping through stock charts manually to find stocks at support.
Why Do Support Levels Matter?
Support levels can be important because they indicate areas where there might be buyers ready to purchase the stock.
Whenever the price reaches a support level, there might be enough demand at that price level to push the price back up.
Traders and investors often pay attention to support levels because they believe that if the price revisits a previous support level, there's a chance that buyers will be present again at that level, potentially leading to another bounce in the stock's price. Support levels are popular among active traders, such as swing traders and day traders.
Our Research on Support Levels
Our specialty here at Stock Market Guides is researching how trading strategies have performed historically. We've spent a lot of time researching support levels.
We did backtests and determined which support levels may have been most effective historically.
We also studied which stocks had the best results with using support levels.
Here is some data that shows how a proprietary Support Level strategy we created has performed historically according to backtests:
Wins
---
Losses
---
Win Percentage
---
Annualized Return
---
Anyone who signs up for our swing trading scanner service will be able to see stocks that qualify for that trading strategy in real time.
How Can Traders Profit from Support Levels?
By recognizing support levels on a stock chart, traders can make informed decisions about when to enter trades or investments with the hope that the stock's price will increase after bouncing off the support level.
Traders use a support level to generate profits by entering long positions (buying stocks or call options) near or just above the support level.
The idea is that if the stock's price revisits the support level, there is a chance that buyers at the old support level might be present again, leading to a potential price rebound.
Traders can manage risk by placing stop loss orders below the support level to close out the trade if the support level fails.
It's important to note support level trades are certainly not guaranteed to be successful, and the effectiveness of support levels can vary depending on the specific trade setup and market conditions.
Learning More About Support Levels
You can contact us any time if you would like to ask any questions about support levels or about anything else related to the stock market.
Join Our Free Email List
Get emails from us about ways to potentially make money in the stock market.
Stock Market Guides
You can trade without an edge, but why?
What We Offer
Stock Market Guides identifies swing trading opportunities that have a historical track record of profitability in backtests.
Average Annualized Return
79.4%