Free Stock Indicator Scanner
Stock Market Guides is not a financial advisor. Our content is strictly educational and should not be considered financial advice.
This is a free scanner that finds stocks meeting the criteria of popular stock indicators.
As of June 11, 2026 at 1:24am Eastern Time
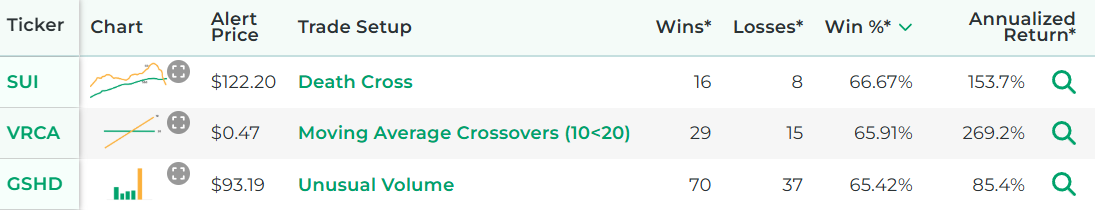
*Wins, Losses, Win Percentage, and Annualized Return are referring to how the stock performed in backtests for the Trade Setup indicated.
How to Use Our Free Stock Indicator Scanner
The above list represents stocks that meet popular stock indicator criteria today.
It's powered by our proprietary stock scanner, which searches once per day for stocks that meet these indicator criteria.
You can sort columns using the up and down arrows next to the column name. You can add filters for the column values by clicking the "Add Filter" button above the list of stocks. This scanner is designed for active stock traders.
This video shows how to use our scanner:
Scanner Features that Require a Subscription
Our free scanner offers you the ability to find stocks that meet popular stock indicator criteria, but you may need more than that to ensure you're making trades that have a true edge.
Our paid Swing Trading Service includes scanner features that are designed to offer you all the intelligence our research can offer. These are the scanner features you get if you pay for a subscription:
- See the historical backtested performance for each scan result. It looks like this:
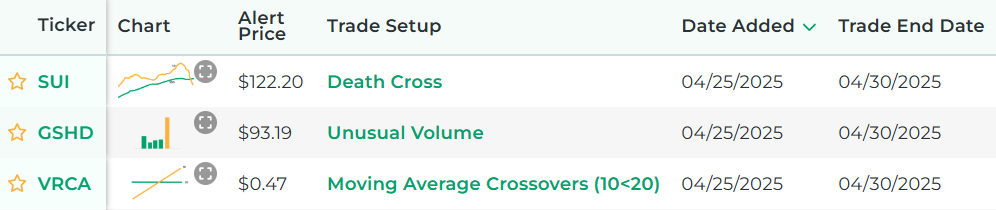
- See full trade setups for each scan result, including when to enter and exit. It looks like this:
- Get alerted when there are new scan results (by text or email).
- Get access to real-time scan updates throughout the trading day.
- Access scan results for all trading strategies in a single scan to easily see which trade setups have the best backtested performance across the entire market at any given time.
- Get access to scan results for our proprietary trading strategies, which required years of research to develop.
- Find Stock Trade Setups That Have a Backtested Edge
- Has DIY Swing Trading Scanner
- Get Swing Trade Picks from Our Scanner: 79.4% Average Annualized Return in Backtests
Here's a video that explains the difference between our free stock indicator scanner and the scanner from our paid service:
Stock Market Guides
Stock Market Guides identifies swing trading opportunities that have a historical track record of profitability in backtests.
Average Annualized Return
79.4%
Which Stock Indicators Are Included In Our Scanner?
The follow popular stock indicators are ones that are included in the above scanner:
Death Cross
A death cross is a stock indicator that is based on a type of moving average crossover.
A moving average crossover is a technical analysis tool used in stock market trading. It involves plotting two different moving averages on a price chart.
A moving average crossover occurs when two moving average lines on a stock chart intersect.
In the case of a death cross, the moving average crossover consists of two moving average lines: a 50-day moving average and a 200-day moving average.
This means that before the death cross occurs, the 50-day moving average is above the 200-day moving average. After the death cross, the 50-day moving average is below the 200-day moving average.
There are different types of moving averages, such as simple moving average lines and exponential moving average lines. A death cross can occur with any type of moving average line.
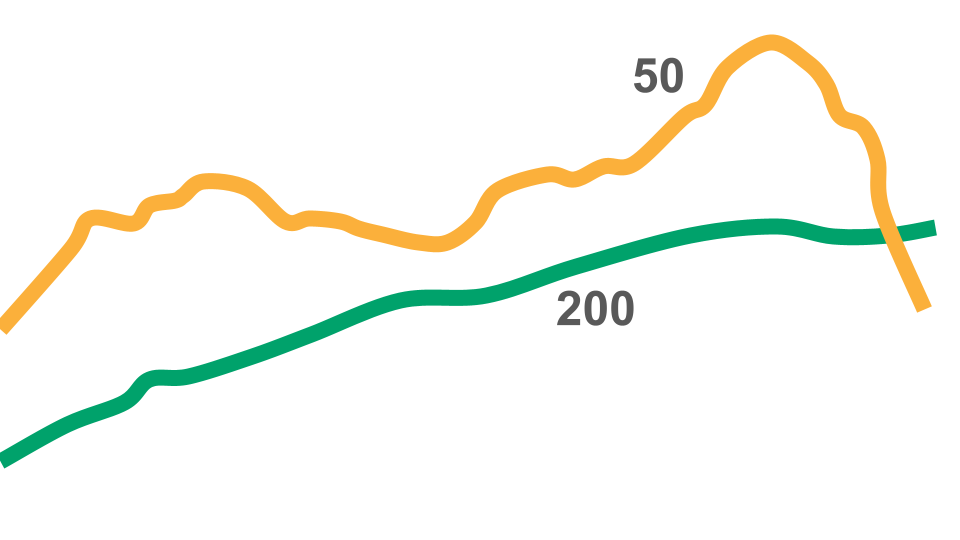
That image is a graphical icon that gives an idea visually of what a death cross looks like according to the depiction of moving average lines.
The death cross occurs when the golden "50" line crosses under the green "200" line.
Golden Cross
A golden cross is a stock indicator that is based on a type of moving average crossover.
A moving average crossover is a technical analysis tool used in stock market trading. It involves plotting two different moving averages on a price chart.
A moving average crossover occurs when two moving average lines on a stock chart intersect.
In the case of a golden cross, the moving average crossover consists of two moving average lines: a 50-day moving average and a 200-day moving average.
This means that before the golden cross occurs, the 50-day moving average is below the 200-day moving average. After the golden cross, the 50-day moving average is above the 200-day moving average.
There are different types of moving averages, such as simple moving average lines and exponential moving average lines. A golden cross can occur with any type of moving average line.
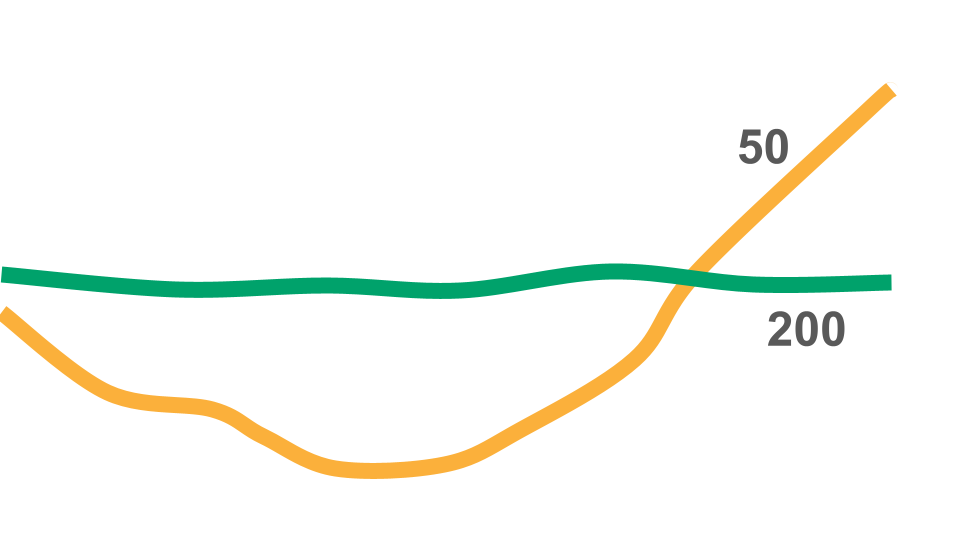
That image is a graphical icon that gives an idea visually of what a golden cross looks like according to the depiction of moving average lines.
The golden cross occurs when the golden "50" line crosses over the green "200" line.
Mean Reversion
The word "mean" is another word for "average". So when someone talks about mean reversion, they're talking about the price of a stock returning to its average price.
A trader in the stock market might use a moving average line on a stock chart to signify the average price. If the stock's price gets noticeably far removed from that average price, a trader might anticipate mean reversion, meaning that the stock price might reverse course and gravitate back to that moving average line.
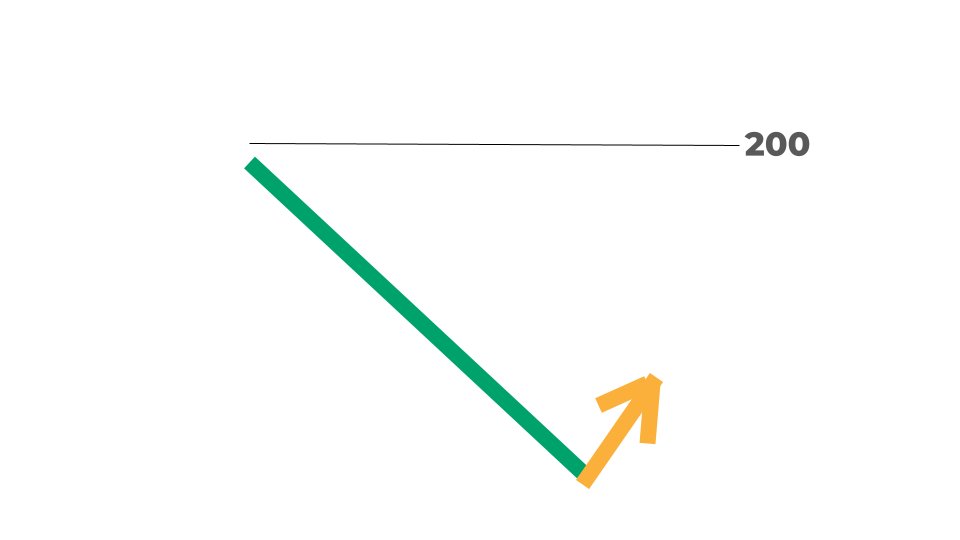
That image is a graphical icon that gives an idea visually of what a mean reversion looks like on a stock chart.
The line that says "200" represents a moving average line, which signifies the average price (or mean). The green line represents the price of the stock as it gets noticeably removed from the moving average line.
The yellow arrow represents a point when a trader might think the stock could be due for mean reversion. The trader anticipates that the stock price could go back up from this point toward the average.
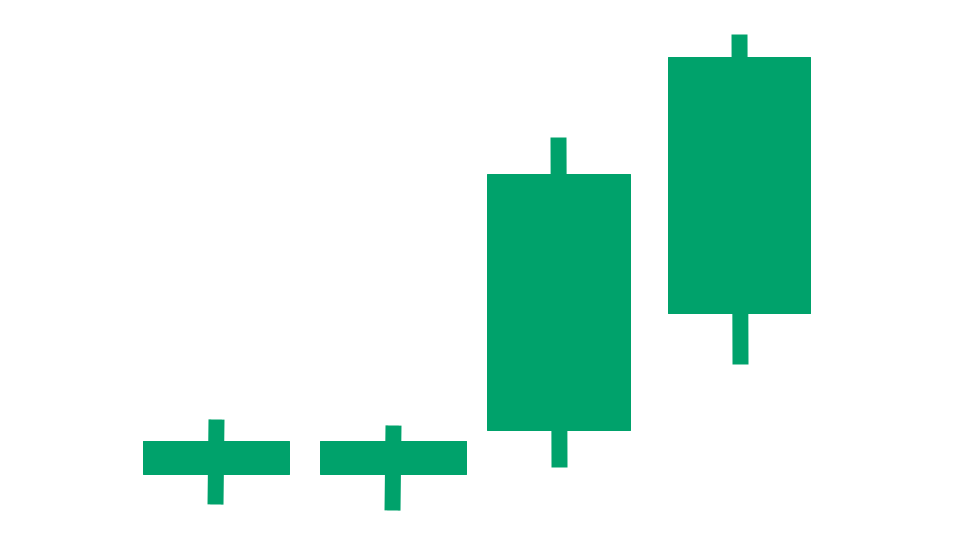
Momentum Stocks
The term momentum stock refers to a stock that has just exhibited a significant upward price movement. A momentum stock's price is volatile.
Momentum is a type of stock indicator. It can be measured in different ways.
One way is to look at its recent price fluctuations and compare them to its average historical fluctuations. If the most recent price fluctuations are higher than average, and those price fluctuations have been in a positive direction, then the stock might be considered a momentum stock.
Another way is to look at its average price fluctuations as a percentage of its stock price. If the average range of its recent price fluctuations is a high percentage of its stock price, and those price fluctuations have been in a positive direction, then it can be said to be a momentum stock.
One useful indicator for defining a momentum stock is average true range (ATR). It calculates the average amount that the price of a stock moved in a period over a given length of time.
Since the ATR captures the range of price fluctuations, it can be used to define a stock's momentum.

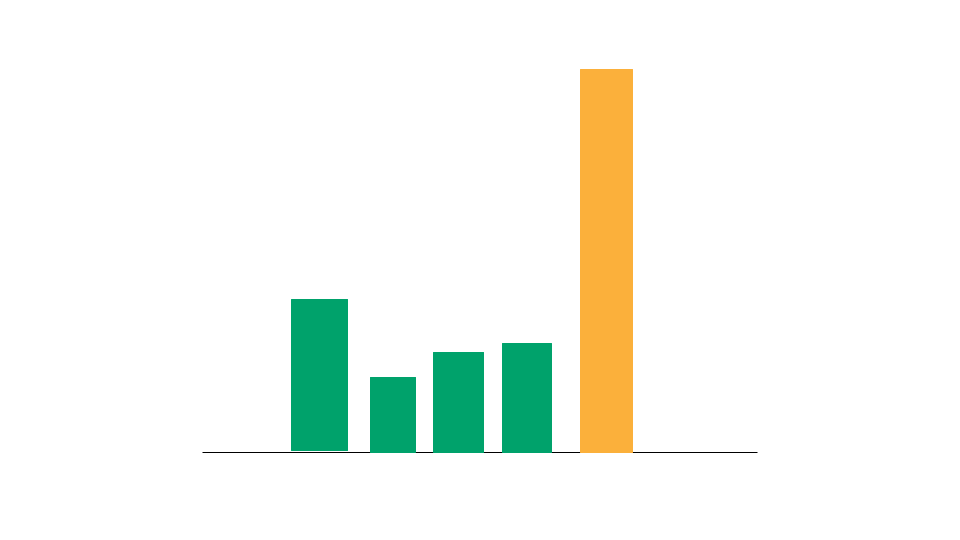
That image is a graphical icon that helps demonstrate what price momentum might look like on a stock chart. Each of the green bars represents the price bars on a stock chart.
You can see how the two recent bars represent 1) an increased range of price relative to the first two bars and 2) upward price movement. This could characterize the stock as a momentum stock.
Moving Average Crossover
A moving average crossover is a stock indicator used in stock market trading. It involves plotting two different moving averages on a price chart.
Here is the formal definition of a moving average crossover:
Typically one of the moving average lines measures a shorter duration than the other. For example, one moving average line might be a 10-period moving average, and the other one might be a 20-period moving average.
It doesn't matter what type of moving average lines they are. They can be simple moving average lines or exponential moving average lines.
It also doesn't matter what time frame your stock chart is set to. A moving average crossover can occur on charts where the price candles are set to one minute, one day, or anything else you prefer.
Oversold Stocks
When someone talks about oversold stocks, they're typically talking about stocks that have a low RSI value.
RSI stands for Relative Strength Index. RSI is a type of oscillating indicator. The RSI value is calculated based on the stock's recent price history and the values range between 0 and 100.
Since the idea is to find a stock that might be due for a rebound in price, a low RSI value is considered a bullish signal.
Here's an example of how an RSI indicator looks in a trading platform:

You'll notice there are two tan lines in that image. The lower one is at an RSI value of 30.
Any time that RSI value goes below that lower tan line, it's a sign that the stock has a low RSI value, or in other words, that it's an oversold stock. You can see in that particular image that the RSI line turns blue when the stock becomes oversold.
Pullback
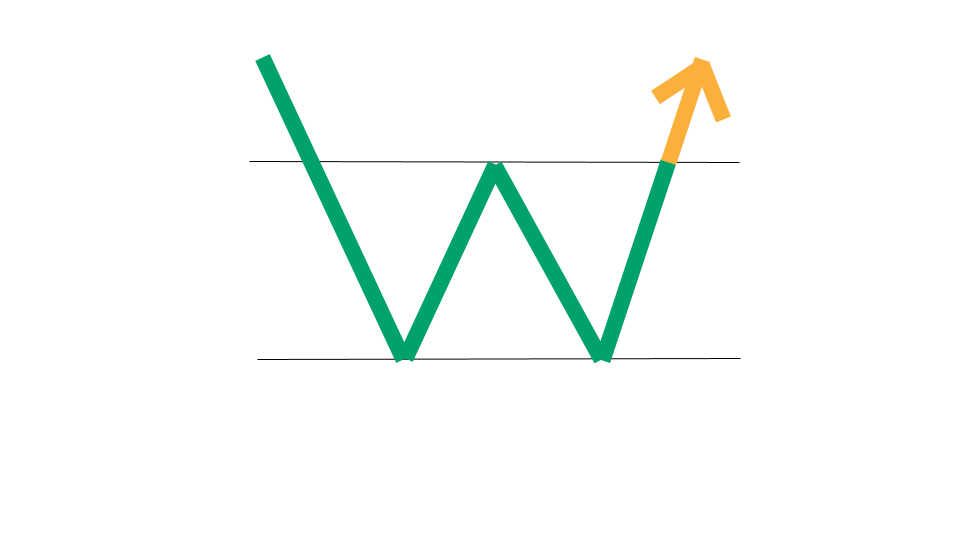
A pullback in stocks refers to price activity that occurs during an uptrend in the stock market.
It happens when a stock's price is trending upward, but temporarily slows down and comes down before potentially continuing its uptrend.
In simpler terms, a pullback is a short-term dip or decline in the price of a stock that is otherwise in an upward trend.
Unusual Volume
A stock with unusual volume is one that has seen a major surge in trading volume recently.
Volume is one of the key indicators in the world of stocks. Volume is defined as how many shares of a particular stock were sold and purchased during a particular period.
Volume therefore indicates the activity level that occurred for a stock during a particular time period. It can be measured in any time increment, such as one day, one minute, or any other increment.
A stock is said to have unusual volume if its most recent volume is particularly high relative to its average historical volume. Another way of putting it is that stocks with unusual volume have high relative volume.
Many trading platforms allow you to enable the volume indicator on stock charts. Volume is often depicted in bar chart format where the height of the bar corresponds with the amount of volume for that time period.
That image is a graphical icon that gives an idea visually of what an unusual volume stock looks like according to its volume indicator.
We highlighted the most recent bar in gold to signify that it has unusual volume. It has high relative volume compared to the other green volume bars next to it.
Volatile Stocks
The term volatile stock refers to a stock that exhibits significant price fluctuations over a given period. In other words, the price of a volatile stock can go up and down a lot.
Volatility in a stock's price can be measured in different ways using different indicators.
One way is to look at its recent price fluctuations and compare them to its average historical fluctuations. If the more recent price fluctuations are higher than average, then the stock might be considered volatile.
Another way is to look at its average price fluctuations as a percentage of its stock price. If the average range of its price fluctuations is a high percentage of its stock price, then it can be said to be a volatile stock.
One useful indicator for measuring the volatility of a stock is average true range (ATR). It calculates the average amount that the price of a stock moved in a period over a given length of time.
Since the ATR captures the range of price fluctuations, it can be used to measure a stock's level of price volatility.
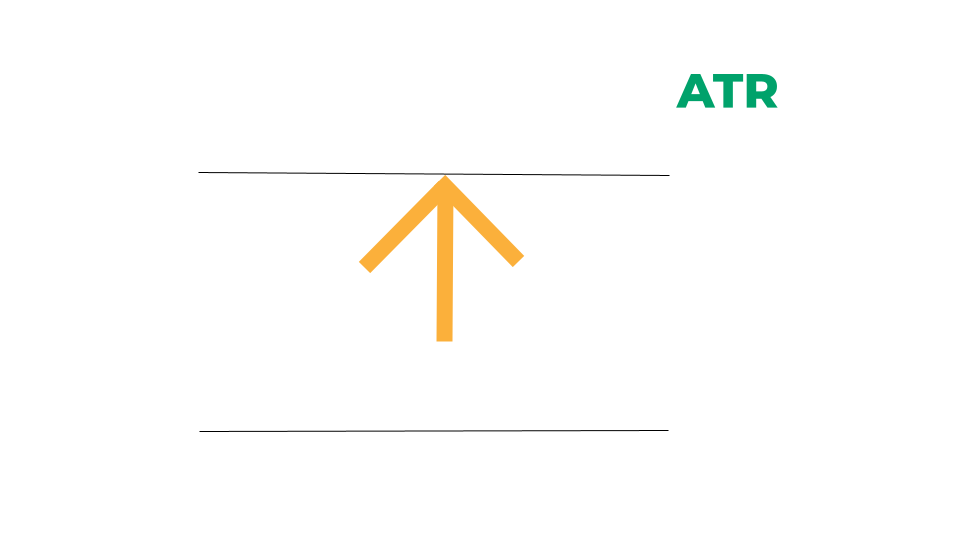
That image is a simple graphical icon that we use to demonstrate that the most volatile stocks typically have a high relative ATR value.
The ATR value could be high relative to its historical average ATR value, or it could be high relative to the stock price.
How We Find Important Stock Indicators Each Day
Our one-of-a-kind scanning technology is at the heart of everything we do here. We have a way to define popular stock indicator values in our scanner, and then it uses real-time data feeds to find any stocks that meet those criteria.
Learn More at Stock Market Guides
Want to learn other popular indicators, chart patterns, and candlestick patterns? Check them out here:

Have Questions About Stock Indicators or About Our Services?
If you have questions about stock indicators or questions about any services we offer, you can contact us any time and we'll be ready to help.
Join Our Free Email List
Get emails from us about ways to potentially make money in the stock market.
Stock Market Guides
You can trade without an edge, but why?
What We Offer
Stock Market Guides identifies swing trading opportunities that have a historical track record of profitability in backtests.
Average Annualized Return
79.4%